Finding the best Currents alternatives in 2025 shouldn't take forever.
Currents is known for real-time Playwright execution streaming, but many teams face limits with analytics, debugging, and role-based insights.
To help you pick the right fit, we compared the top options based on setup time, CI/CD integration, and reporting depth.
To address these needs, we've compiled the 8 best Currents alternatives worth considering.
Best Currents Alternatives
We've researched and compared a number of tools to produce this list of best Currents alternatives. The key considerations we examined are the ease of setup, integration with CI/CD, AI debugging, scalability, cost, multi-browser support, and general test reporting experience.
The list is carefully selected in order to assist QA teams, test leaders, and engineering managers in identifying the proper solution for their testing and automation requirements.
How to Compare Currents Alternatives
Here is a quick comparison of top alternatives to Currents that can help you identify your preferred test reporting tool:
TestDino |  Currents |  DataDog Test Optimization |  Microsoft Playwright Testing |  TestRail | |
|---|---|---|---|---|---|
| Pricing (starts at) | $49/month | $49/month | $28/month | $3.50/ 1,000 test results | $35/month |
| Best for | Playwright Reporting & Analytics | Dashboards & Orchestration | CI and test visibility | Azure users | Test case management |
| Framework support | Playwright | Playwright & More | Playwright & More | Playwright | Playwright & More |
| Ease of use |  |  | | | |
Getting Started | |||||
AI & failure insights | |||||
Test runs & summaries | |||||
Test cases | |||||
Analytics & trends | |||||
Dashboards & UX | |||||
Integrations & alerts | |||||
| Try for free | Learn more | Learn more | Learn more | Learn more | |
Best Currents Competitors for Modern Test Reporting
Here are the top 7 best alternatives to Currents that you can choose from to streamline your test reporting:
1. TestDino
$49
/monthBest for:
Playwright first teams, QA leads, DevOps managers, and engineering teams who want AI-powered QA test reporting and faster debugging.
Platform Type:
Web app dashboard (Playwright native)
Integrations with:
Jira, Linear, Slack, GitHub, GitHub Actions
Key Features:
 AI-driven failure categorization (Actual Bug, UI Change, Unstable Test, Miscellaneous)
- Flaky test detection with historical trends
- Role-Based dashboards (QA, DevOps, managers)
- Test Run explorer with logs, screenshots, retries
- PR-based insights showing pass/fail next to code
- With GitHub integration enabled, TestDino posts AI-generated test run summaries to the relevant commits and pull requests.
- Failure error classifications
- Instant Slack alerts with test summaries
- One-click bug filing into Jira/Linear

Pros
- Built Playwright native, faster setup
- Cuts debugging time with AI insights and automated triage.
- Provides team specific views (QA sees flaky tests, managers see stability metrics).
- Cost-effective compared to enterprise heavy tools with quality test reporting.

Cons
- Currently optimized for Playwright only.
First Hand-Experience
TestDino gives Playwright teams faster insight with AI-driven reporting at a lower operational cost than traditional platforms. It ingests standard Playwright outputs, classifies failures with confidence scores, and maps every run to its branch, environment, and pull request.
The result is a clear, centralized view of quality that turns noisy failures into priorities your team can act on immediately. Because it is Playwright-native and integrates directly into CI, setup takes minutes, not days.
Teams get one source of truth for runs, traces, screenshots, videos, and logs, plus role-based dashboards that keep QA, developers, and managers aligned on what blocks release and what can wait.
Smart Reporting & Debugging
TestDino goes beyond pass or fail. AI groups similar errors, labels each failure as Actual Bug, UI Change, Unstable Test, or Misc, and highlights persistent versus emerging issues with confidence scores.
That context explains why tests failed and where to start, collapsing triage from hours to minutes. The Test Runs view adds status, branch, environment, and AI tags to each execution.
Open a run to see Summary, Specs, History, Configuration, and AI Insights. Evidence is one click away: error text, step timeline, screenshots, and console per attempt or retry. Developers get PR-aware feedback that separates flakes from real blockers, so fixes land faster.
CI/CD Speed & Test Coverage
Built for modern pipelines, TestDino plugs into your CI to upload Playwright reports after execution. It supports parallel runs and exposes timing intelligence so you can identify slow specs, branches, or days without adding framework overhead.
Analytics quantifies average and fastest run times, time saved, speed drift by day, and distribution of fast versus slow runs. Coverage and stability are visible at every level. The Test Case view surfaces slow tests and pass/fail history.
Environment analytics compare success rates and volumes across mapped environments and operating systems, making it obvious whether a slowdown is code, data, or infrastructure. Combined with flaky detection and retry analysis, teams shorten feedback loops without re-running entire suites.
Team and Client Collaboration
Role-based dashboards keep each stakeholder focused. The QA dashboard flags flaky clusters and failure categories. The Developer dashboard focuses on PR health, active blockers, and branch stability. The Manager dashboard rolls up trend metrics for release readiness and risk.
Everyone sees the same source of truth, filtered to what they need. Integrations remove copy-paste from communication. Raise Jira or Linear issues prefilled with evidence and history.
Send compact run summaries to Slack with direct links to proof. For distributed teams and client reviews, TestDino's PR view shows full run and retry history with passed, failed, flaky, and skipped counts, so decisions are made with context and audits are straightforward.
Pricing & Value
Four distinct plans are available on TestDino; each specifically created to meet the demands of its consumers.
Final Verdict
TestDino is a strong choice among Currents alternatives due to affordable pricing, faster onboarding, and Playwright native support.
It delivers AI-driven debugging, flaky test detection, and confidence-scored insights that shorten triage time and improve reliability at scale. Role-based dashboards, PR-aware feedback, and persistent history make failure context clear and actionable.
Compared with Currents, TestDino provides deeper Playwright integration, in-depth analytics across runs, cases, and environments, and CI/CD optimization without added framework overhead.
The lightweight setup, direct PR mapping, and Slack/Jira/Linear integrations enable QA teams, developers, and managers to collaborate on one source of truth.
If you are evaluating Currents alternatives, TestDino offers a practical, cost-efficient platform that prioritizes speed, clarity, and measurable quality gains.
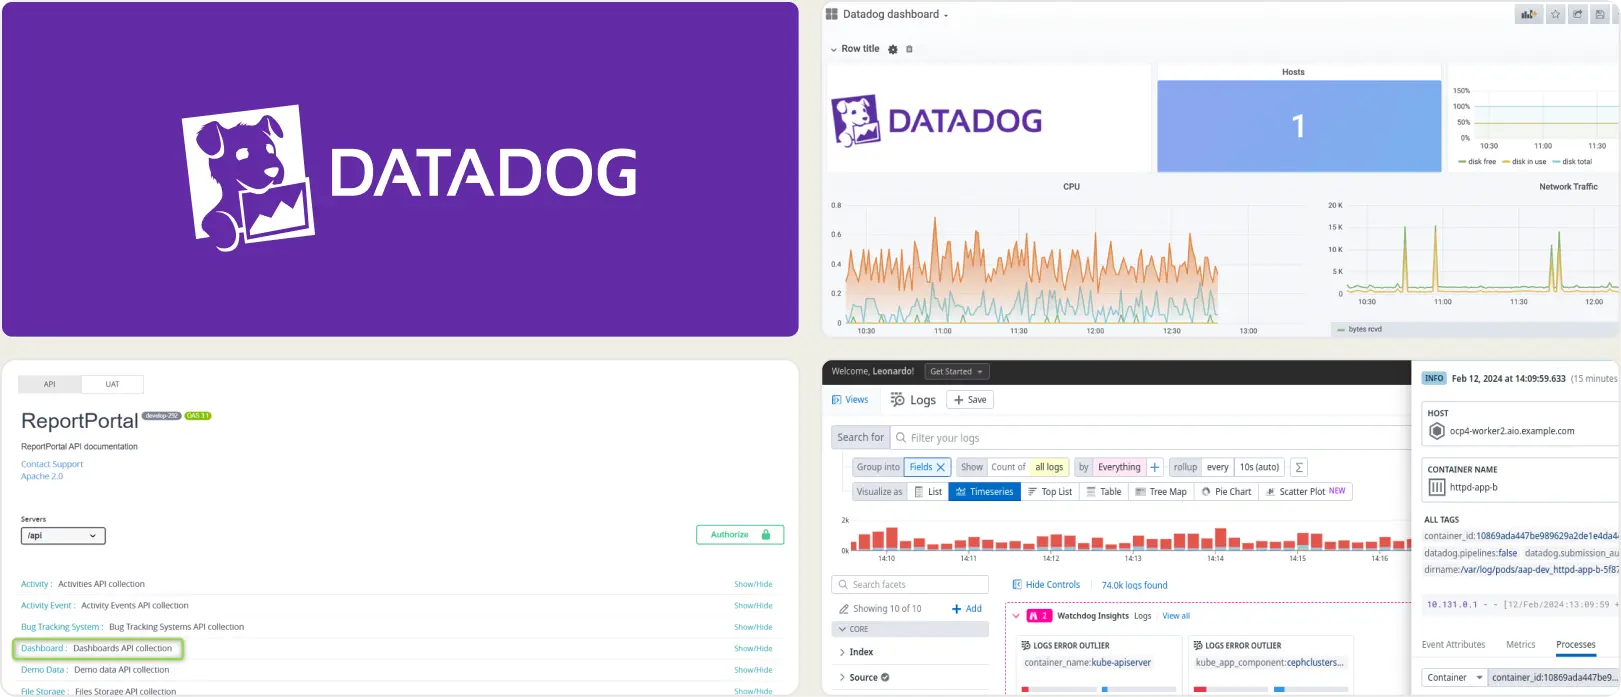
2. Datadog Test Optimization
Best for:
Organizations already use Datadog for observability and want test monitoring add ons.
Platform Type:
Cloud dashboard platform
Integrations with:
CI/CD, Slack, Jira
Key Features:
- End-to-end observability across logs, metrics, traces, and tests
- Synthetic browser and API testing
- Custom dashboards and widgets
- Alerting and incident workflows
- Correlation between test results and backend signals
Pros
- Strong, mature observability suite
- Efficient for teams already using DataDog
- Rich ecosystem and integrations
- Scales to large, distributed systems
Cons
- Cost can rise quickly with test volume and data retention
- Not specialized for deep test analytics and triage
- Steeper learning curve for QA-focused users
First Hand-Experience
DataDog Test Optimization extends familiar observability practices into test monitoring, which benefits teams already operating within its ecosystem.
The breadth is significant, although day-to-day test analysis may require navigation across multiple modules and custom dashboards.
QA-led groups seeking streamlined triage may find the experience broad rather than purpose-built.
Pricing & Value
The usage-based model aligns spend with data ingestion and retention, but costs can be difficult to forecast as logs, traces, and test artifacts scale.
For buyers researching DataDog Test Optimization Alternatives, the value is highest when unified observability is a core requirement and test data must live beside infrastructure telemetry.
Final Verdict
DataDog Test Optimization is a strong option for enterprises that want test observability embedded in a full-stack monitoring platform.
Teams reviewing DataDog Test Optimization competitors and reading DataDog Test Optimization reviews should consider whether they need a general observability layer or a specialized test reporting tool with focused debugging features.
If predictable costs and streamlined QA analytics are priorities, include dedicated DataDog Test Optimization alternatives in your shortlist.
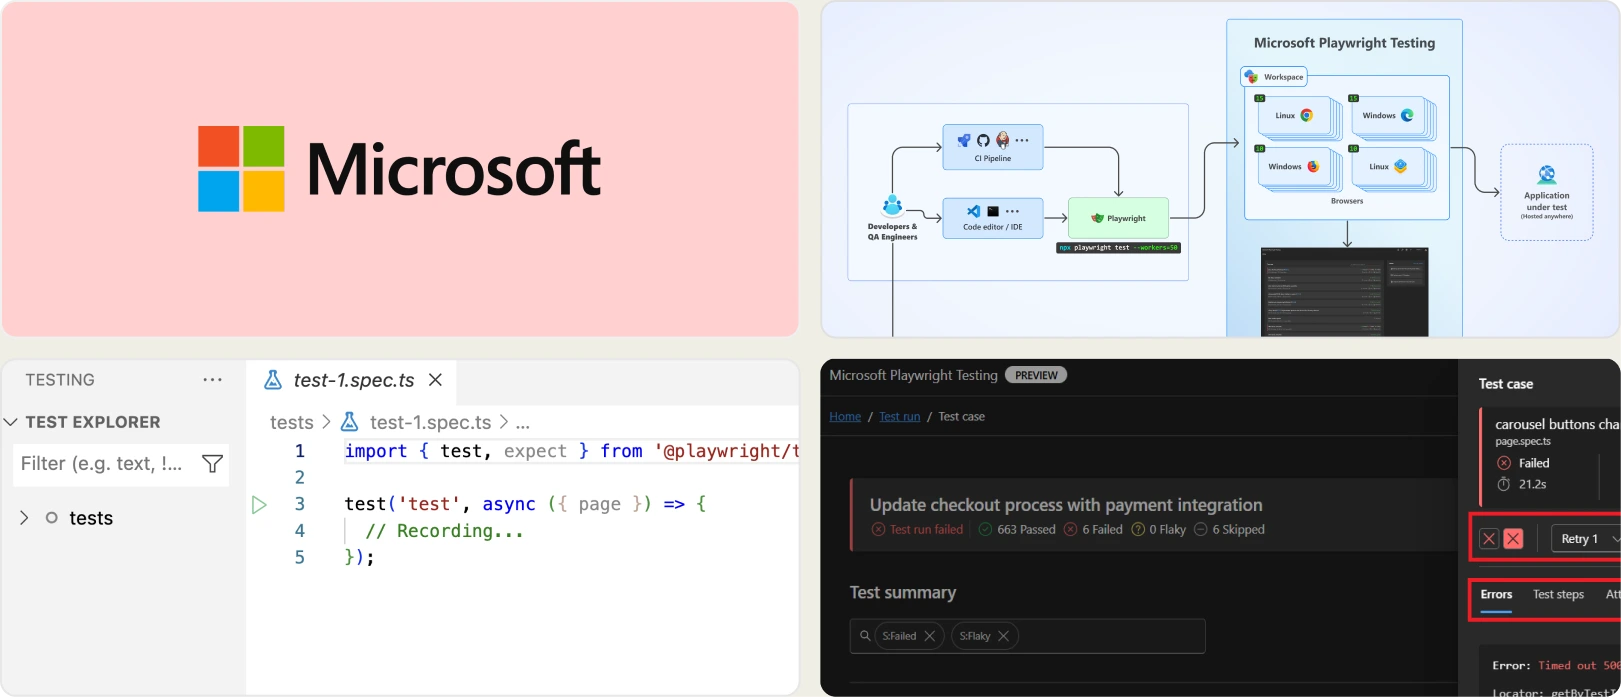
3. Microsoft Playwright Testing
Best for:
Teams needing cloud scale execution of Playwright tests.
Platform Type:
Azure portal dashboard
Integrations with:
Azure DevOps, GitHub Actions
Key Features:
- Cloud execution for Playwright tests
- Horizontal parallel scaling
- Centralized artifact storage (videos, traces, logs)
- CI/CD workflow integration
- Basic run summaries and status
Pros
- Official Playwright cloud infrastructure
- Strong parallelization for large suites
- Smooth setup inside Azure ecosystem
Cons
- Execution focused, limited analytics
- Minimal debugging intelligence
- Azure vendor lock-in risk
First Hand-Experience
Microsoft Playwright Testing delivers reliable cloud browsers and high parallelism. Runs start quickly and artifacts are easy to retrieve from the portal.
Day-to-day, the service is optimized for executing tests rather than analyzing them, so teams that rely on detailed failure categorization or role-specific insights will likely complement it with a dedicated reporting layer.
Pricing & Value
Pay-as-you-go pricing aligns cost with minutes consumed and parallelism. This makes pilots straightforward, but budgets should account for sustained suite growth, retries, and peak parallel runs.
For buyers researching Microsoft Playwright Testing Alternatives, factor the trade-off between managed scale and the depth of test reporting you need long term.
Final Verdict
A strong choice for Azure-first organizations that need to scale Playwright testing quickly in the cloud.
Teams reviewing Microsoft Playwright Testing competitors and reading Microsoft Playwright Testing reviews should confirm whether execution speed alone meets their goals.
If they also require advanced analytics, PR-aware context, and AI-assisted debugging often found in specialized test reporting platforms.
4. TestRail
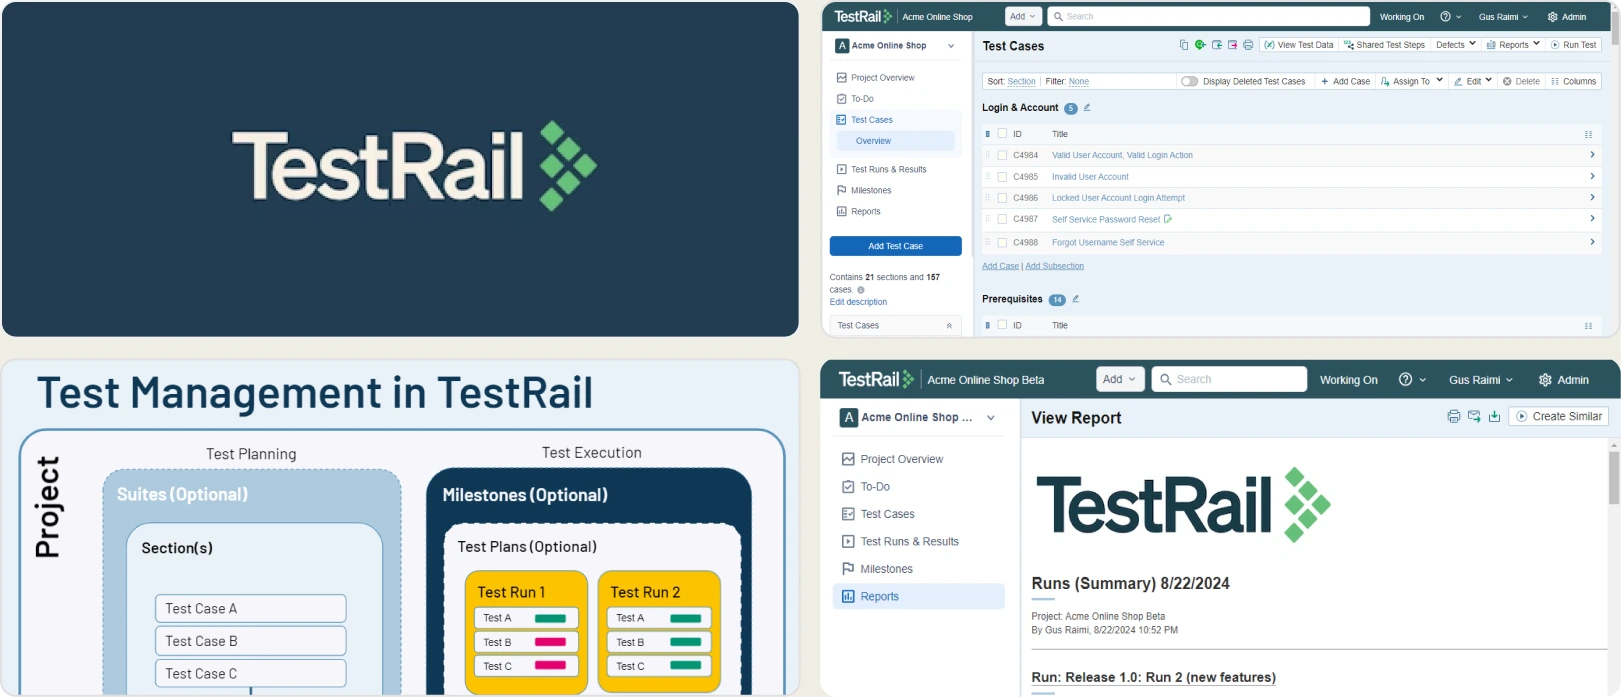
Best for:
QA teams looking for open source flexibility with basic test analytics.
Platform Type:
Web dashboard platform
Integrations with:
Jenkins, GitHub, GitLab, Jira, Slack, etc.
Key Features:
- Open source test reporting
- Real-time launch/run reporting
- Failure clustering and auto-analysis
- Flaky test detection via history
- Custom dashboards, widgets, AQL filtering
- REST API and export options
Pros
- Free open source core
- Broad framework and CI/CD coverage
- Flexible dashboards and filters
- Community and enterprise support options
Cons
- Limited AI-driven insights out of the box
- Requires hosting, setup, and ongoing maintenance
- UI and UX feel less modern than newer tools
- PR-focused analytics require additional wiring
First Hand-Experience
ReportPortal provides transparency and extensibility typical of open source, plus useful auto-analysis for grouping failures. In practice, teams often allocate ongoing developer time for upgrades, scaling, and fine-tuning dashboards.
The interface is functional, though it may feel dated for stakeholders who expect polished, role-specific views.
Pricing & Value
The open source tier is attractive for cost control, but total cost of ownership includes servers, observability, backups, and engineering effort. Managed SaaS plans reduce operational burden yet move pricing into an enterprise bracket.
For buyers researching ReportPortal competitors and ReportPortal reviews, value hinges on whether your team prefers do-it-yourself flexibility or a turnkey experience with faster insight delivery.
Final Verdict
ReportPortal is a solid option for organizations that prioritize open source, need multi-framework aggregation, and can invest in maintenance.
Teams exploring test reporting and automation analytics within the broader landscape of ReportPortal Alternatives may also consider how important quick onboarding, PR-aware insights, and low-overhead operations are to their roadmap. If speed to value and minimal upkeep are priorities, shortlist accordingly.
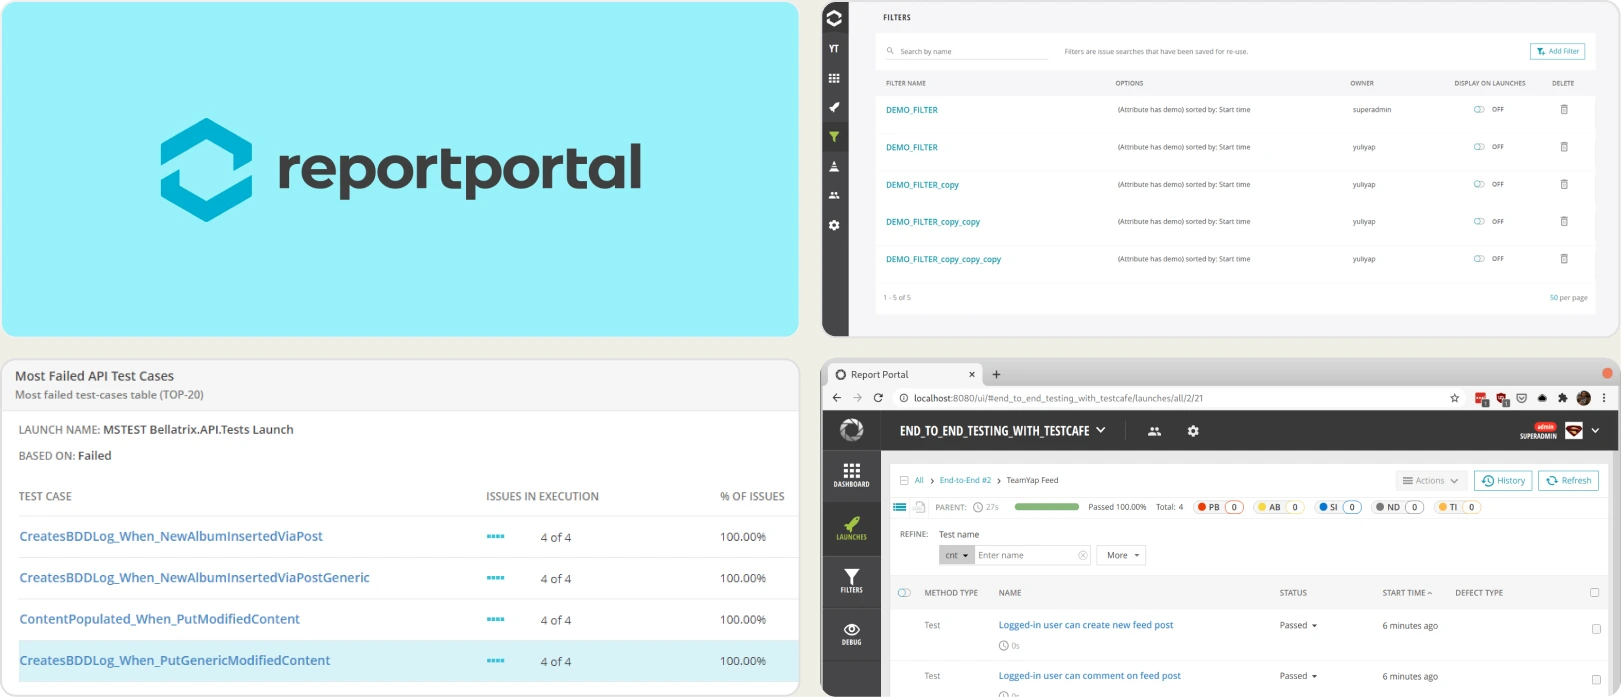
5. ReportPortal
Best for:
QA teams looking for open source flexibility with basic test analytics.
Platform Type:
Web dashboard platform
Integrations with:
Jenkins, GitHub, GitLab, Jira, Slack, etc.
Key Features:
- Open source test reporting
- Real-time launch/run reporting
- Failure clustering and auto-analysis
- Flaky test detection via history
- Custom dashboards, widgets, AQL filtering
- REST API and export options
Pros
- Free open source core
- Broad framework and CI/CD coverage
- Flexible dashboards and filters
- Community and enterprise support options
Cons
- Limited AI-driven insights out of the box
- Requires hosting, setup, and ongoing maintenance
- UI and UX feel less modern than newer tools
- PR-focused analytics require additional wiring
First Hand-Experience
ReportPortal provides transparency and extensibility typical of open source, plus useful auto-analysis for grouping failures. In practice, teams often allocate ongoing developer time for upgrades, scaling, and fine-tuning dashboards.
The interface is functional, though it may feel dated for stakeholders who expect polished, role-specific views.
Pricing & Value
The open source tier is attractive for cost control, but total cost of ownership includes servers, observability, backups, and engineering effort. Managed SaaS plans reduce operational burden yet move pricing into an enterprise bracket.
For buyers researching ReportPortal competitors and ReportPortal reviews, value hinges on whether your team prefers do-it-yourself flexibility or a turnkey experience with faster insight delivery.
Final Verdict
ReportPortal is a solid option for organizations that prioritize open source, need multi-framework aggregation, and can invest in maintenance.
Teams exploring test reporting and automation analytics within the broader landscape of ReportPortal Alternatives may also consider how important quick onboarding, PR-aware insights, and low-overhead operations are to their roadmap. If speed to value and minimal upkeep are priorities, shortlist accordingly.
6. BrowserStack Test Reporting
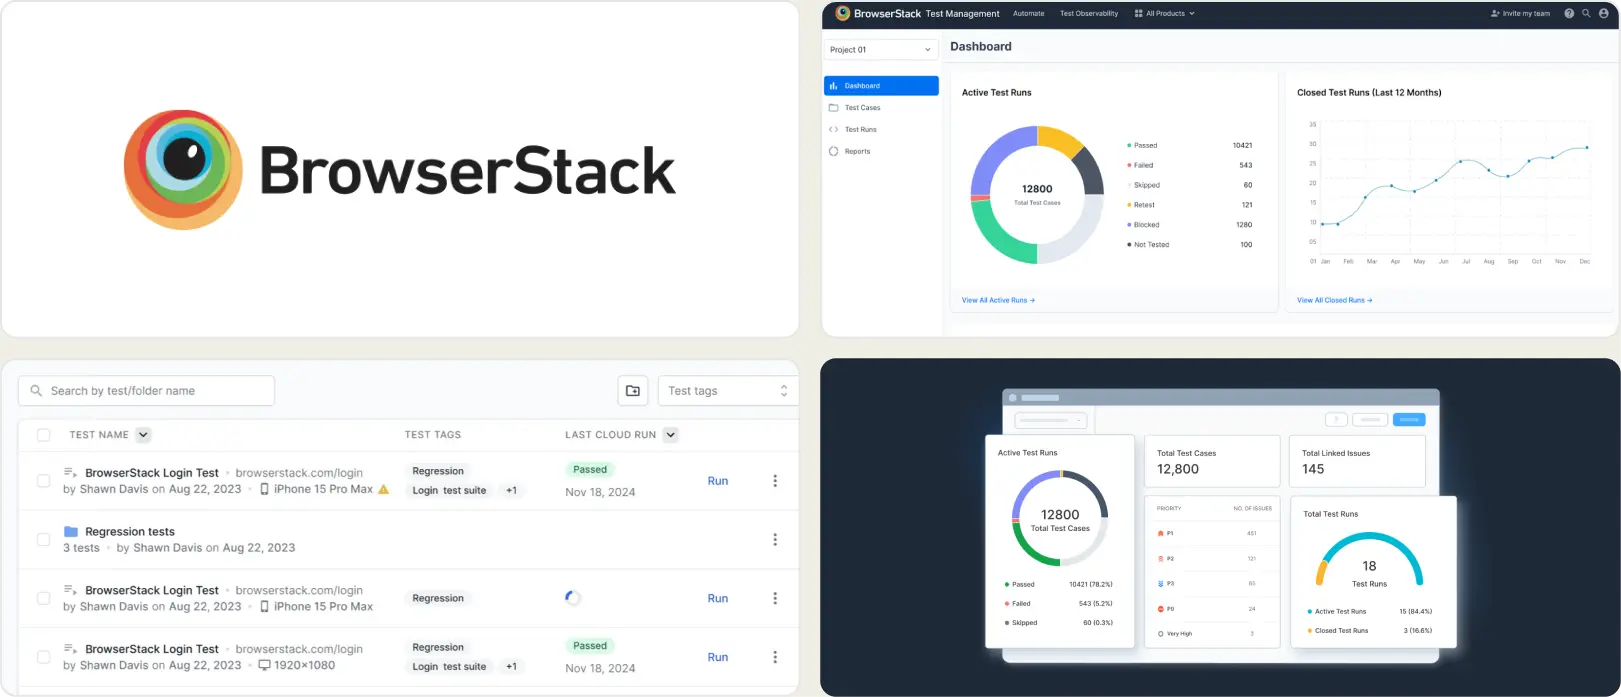
Best for:
Teams are already using BrowserStack for cross-browser testing.
Platform Type:
Cloud dashboard platform
Integrations with:
Jira, CI/CD tools
Key Features:
- Test execution reports
- Cross-browser insights
- Screenshots and video recording
- Centralized dashboard for runs
- Basic trends and error grouping
Pros
- Seamless if on BrowserStack
- Easy cloud onboarding
- Works well for cross-browser runs
Cons
- Limited analytics depth
- Execution-centric, not analysis-centric
- Less tailored for Playwright debugging
First Hand-Experience
BrowserStack Test Reporting handles execution visibility across browsers and devices reliably. Logs, screenshots, and videos are easy to access, which helps during active triage.
Over time, teams that rely on historical signals, role-specific views, or granular root-cause patterns may find the reporting layer relatively basic for long-term optimization.
Pricing & Value
Reporting is bundled, which simplifies procurement. Pricing scales with browser minutes and test volume, so costs can rise as automation and parallelism increase.
Teams comparing BrowserStack Alternatives should factor ongoing usage patterns, retention needs, and the depth of Playwright reporting required.
Final Verdict
A solid choice for organizations prioritizing cloud execution and quick visibility across devices.
For buyers researching BrowserStack competitors, BrowserStack Test Reporting alternatives, and reading BrowserStack reviews, evaluate whether your roadmap emphasizes execution coverage or advanced test analytics and debugging depth.
If long-term insight and scalability of analysis are key, shortlist platforms designed for deeper diagnostics in addition to cross-browser runs.
7. Allure TestOps
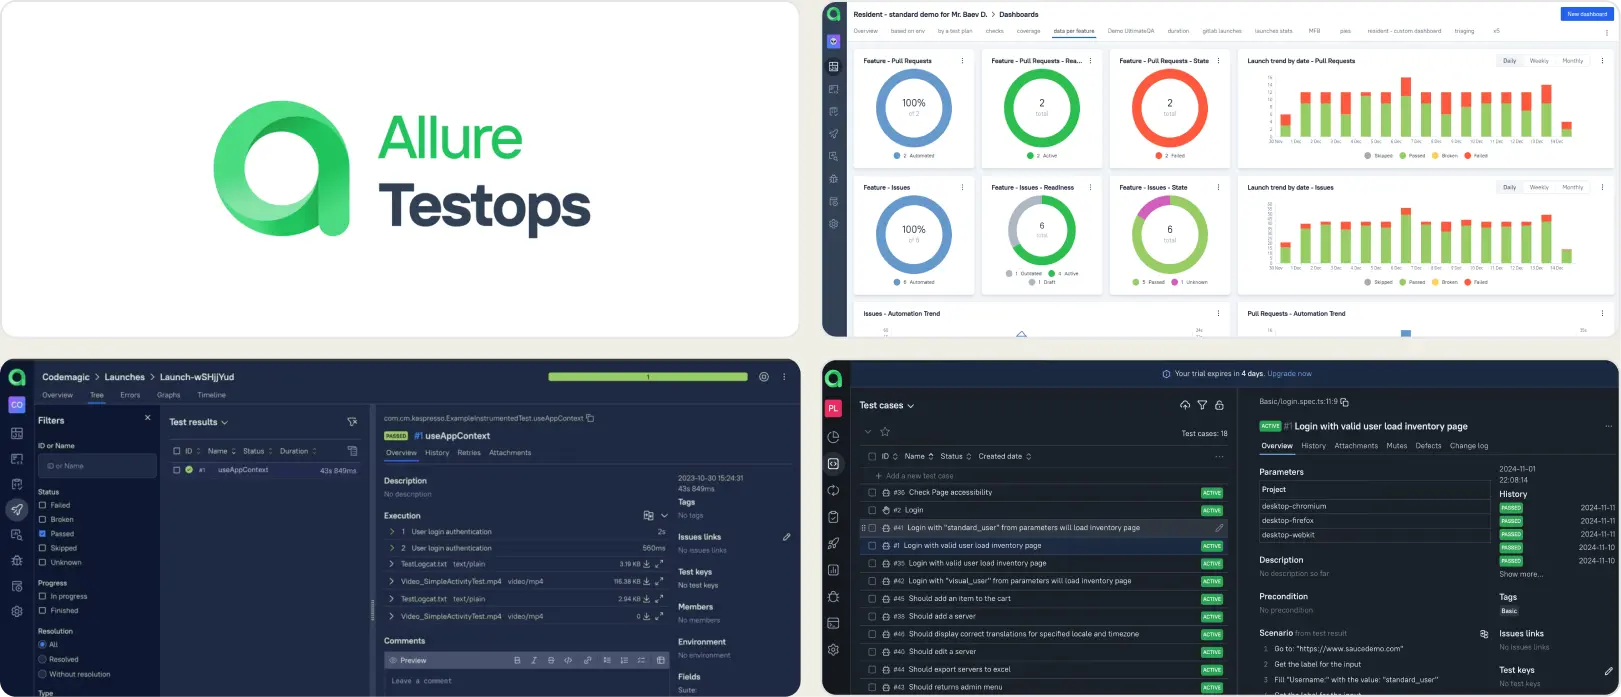
Best for:
Large enterprises and QA teams looking for end to end test reporting and management solutions.
Platform Type:
Web dashboard platform
Integrations with:
Jira, GitHub, GitLab, Jenkins
Key Features:
- Centralized test case management and reporting
- Historical trend and coverage analysis
- Broad CI/CD and VCS integrations
- Role-based access control and permissions
- Custom dashboards via AQL and exportable reports
Pros
- Mature, enterprise-proven feature set
- Strong test case and requirement management
- Comprehensive CI/CD integration options
- Flexible dashboards and reporting exports
Cons
- Heavy for small to mid-size teams
- Setup and ongoing maintenance can be significant
- Advanced insights often require configuration and curation
First Hand-Experience
Allure TestOps presents a robust, feature-rich workspace for test operations. In practice, the depth is most valuable when teams already have defined QA processes and the bandwidth to configure adapters, data models, and dashboards.
Smaller or faster-moving groups may find the initial lift non-trivial, as meaningful outcomes often depend on disciplined setup and governance.
Pricing & Value
With custom enterprise pricing, the platform aligns well to organizations that prioritize centralized governance, auditability, and standardized reporting at scale.
For buyers researching Allure TestOps alternatives, value depends on whether the team needs comprehensive test management or is prioritizing faster onboarding and leaner day-to-day operations.
Final Verdict
Allure TestOps is a strong fit for enterprises seeking a full test management layer with governance, history, and broad integrations.
Teams evaluating test automation tools and reading Allure TestOps reviews will appreciate its maturity and configurability.
For groups optimizing for speed of adoption, focused QA test reporting, and minimal overhead, consider where your current process sits on the spectrum of "full TestOps management" versus "streamlined execution analytics" when shortlisting Allure TestOps competitors.
8. LambdaTest Test Analytics
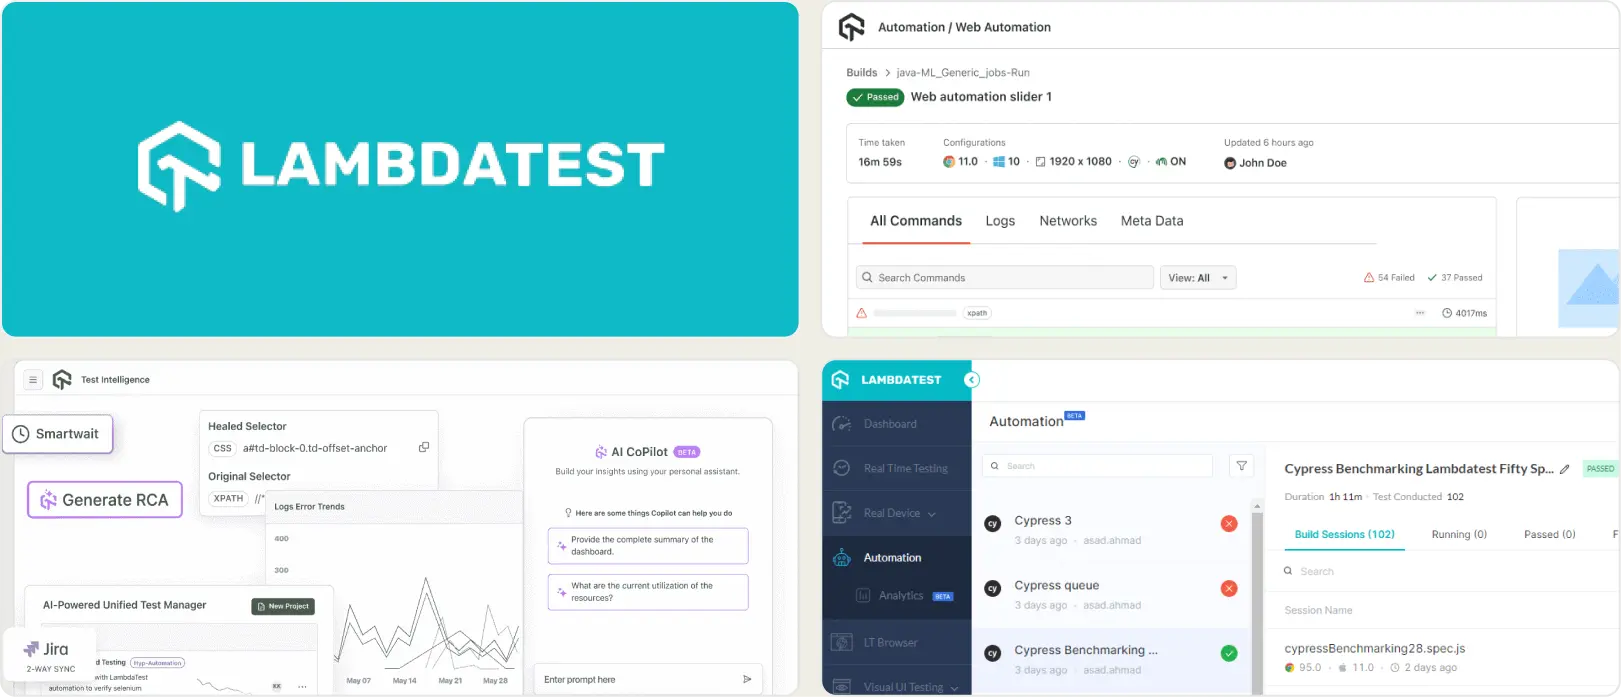
Best for:
Teams needing cross browser cloud testing with parallel execution.
Platform Type:
Cloud dashboard platform
Integrations with:
Jira, Trello, CI/CD pipelines
Key Features:
- Cross-browser and real-device coverage
- Cloud automation grid with parallelism
- Screenshots, video, and logs
- Basic test execution insights
- CI/CD triggers and reporting hooks
Pros
- Affordable entry pricing
- Wide browser and device matrix
- Good for functional and visual checks
- Quick cloud onboarding
Cons
- Reporting secondary to execution
- Limited advanced test analytics
- Playwright-native reporting is basic
- Deeper insights often require add-ons
First Hand-Experience
LambdaTest Test Analytics delivers dependable cloud execution across browsers and devices, which helps teams expand coverage quickly. The dashboard surfaces runs, artifacts, and essential telemetry without heavy setup.
Over longer horizons, teams seeking granular test analytics, flaky detection depth, or role-specific insights may feel constrained by reporting that emphasizes execution over analysis.
Pricing & Value
Entry-level plans are cost-effective for pilots and smaller suites. As concurrency, minutes, and device usage increase, higher tiers are typically required for throughput and retention.
Buyers researching LambdaTest Test Analytics Alternatives, LambdaTest Test Analytics Reviews, and broader LambdaTest Test Analytics Alternatives should model expected parallel sessions and artifact storage to project total cost.
Final Verdict
LambdaTest Test Analytics is an affordable, flexible option for cross-browser and device execution with straightforward cloud operations.
For leaders evaluating LambdaTest Test Analytics competitors in the context of test analytics and Playwright automation, consider whether long-term priorities include advanced debugging signals, historical stability views, and role-aware reporting, in addition to scalable execution.
How to Select the Proper Currents Alternative
Selecting the proper Currents alternative involves selecting a tool that best meets your team's test reporting, automation, and analytics requirements.
Start by outlining your QA priorities, consider cross-browser coverage, test stability, and integration with CI/CD. As you browse alternatives, bear in mind:
Intelligent Reporting and Debugging
An effective Currents alternative does more than merely display test outcomes; it offers actionable information.
Watch for attributes such as flaky test identification, failure clustering, and trace execution analysis.
Platforms that natively support Playwright can speed debugging by enabling teams to see why tests fail instead of merely reporting they did so.
Collaboration Across Teams
Successful collaboration among engineering leaders, QA engineers, and DevOps requires effective tools.Choose tools with role-specific dashboards, real-time notifications, and easy sharing of results.
The ideal platform enables developers, managers, and QA engineers to access the relevant information without having to sort through noise or complex interfaces.
Analytics and Test Coverage
Data-driven decision-making is the key to enhancing test reliability and release confidence.
Visibility into test stability across browsers, devices, and environments enables teams to make more informed test strategies and better release decisions.
CI/CD Integration and Speed
Today's development teams require tools that naturally integrate into their workflows. Search for alternatives with fast onboarding, natively supported Playwright, concurrent test execution, and CI/CD-friendly workflows.
Tracing capture and real-time reporting can reduce debugging cycles and accelerate delivery.
Ease of Use & Support
A user-friendly platform cuts onboarding time and operational overhead. Choose tools with advanced features and easy to use dashboards and responsive support, making them accessible to small QA teams and large enterprise organizations alike.
Wrapping Up
Selecting the ideal Currents alternative can significantly impact your team's speed, test quality, and release confidence.
Evaluate your existing testing configuration, CI/CD needs, and future objectives before choosing the ideal tool. In high-paced engineering settings, depending on out-of-date or limited reporting tools slows down your teams.
Newer options provide quicker setup, AI-driven debugging, easy-to-use analytics, and improved team collaboration giving your teams the advantage in effective and trustworthy test automation.
Add AI triage to every run
Group failures by root causeFix issues before mergeFAQs
TestDino is Playwright-native, fast to set up, and adds AI failure classification, flaky detection, and role-based dashboards. It focuses on faster triage and PR-aware insights.
Related Alternatives
Looking for more options? Browse related alternative tools that might fit your workflow better.