Find your flakiest specs in seconds, not hours.
Sort specs by flaky rate, find the worst offenders, and drill into individual test health.

Hundreds of tests and no way
to see the big picture
Something is unstable in your suite but you do not know where to start looking.

No overview of which spec files are healthy and which are not
You know some tests are failing or flaky, but you cannot see which spec files are the worst offenders. Without a spec-level health view, you are guessing where to focus your stabilization effort.
Pass rates and flaky rates exist nowhere in your workflow
Playwright gives you pass/fail per test per run. But what is the pass rate of your login spec over the last 30 runs? That data exists in scattered CI logs but nobody has aggregated it.
Slow tests hide in plain sight
Some spec files take 5 minutes to run while others take 10 seconds. But you have never sorted your specs by duration because no tool shows you that view. Slow tests waste CI time every single run.
No way to track suite health over time
Is your test suite getting more stable or less stable? Are flaky rates going up or down? Without trend data, you cannot answer these questions. You cannot improve what you do not measure.
Your suite is unstable.
You do not know where to look.
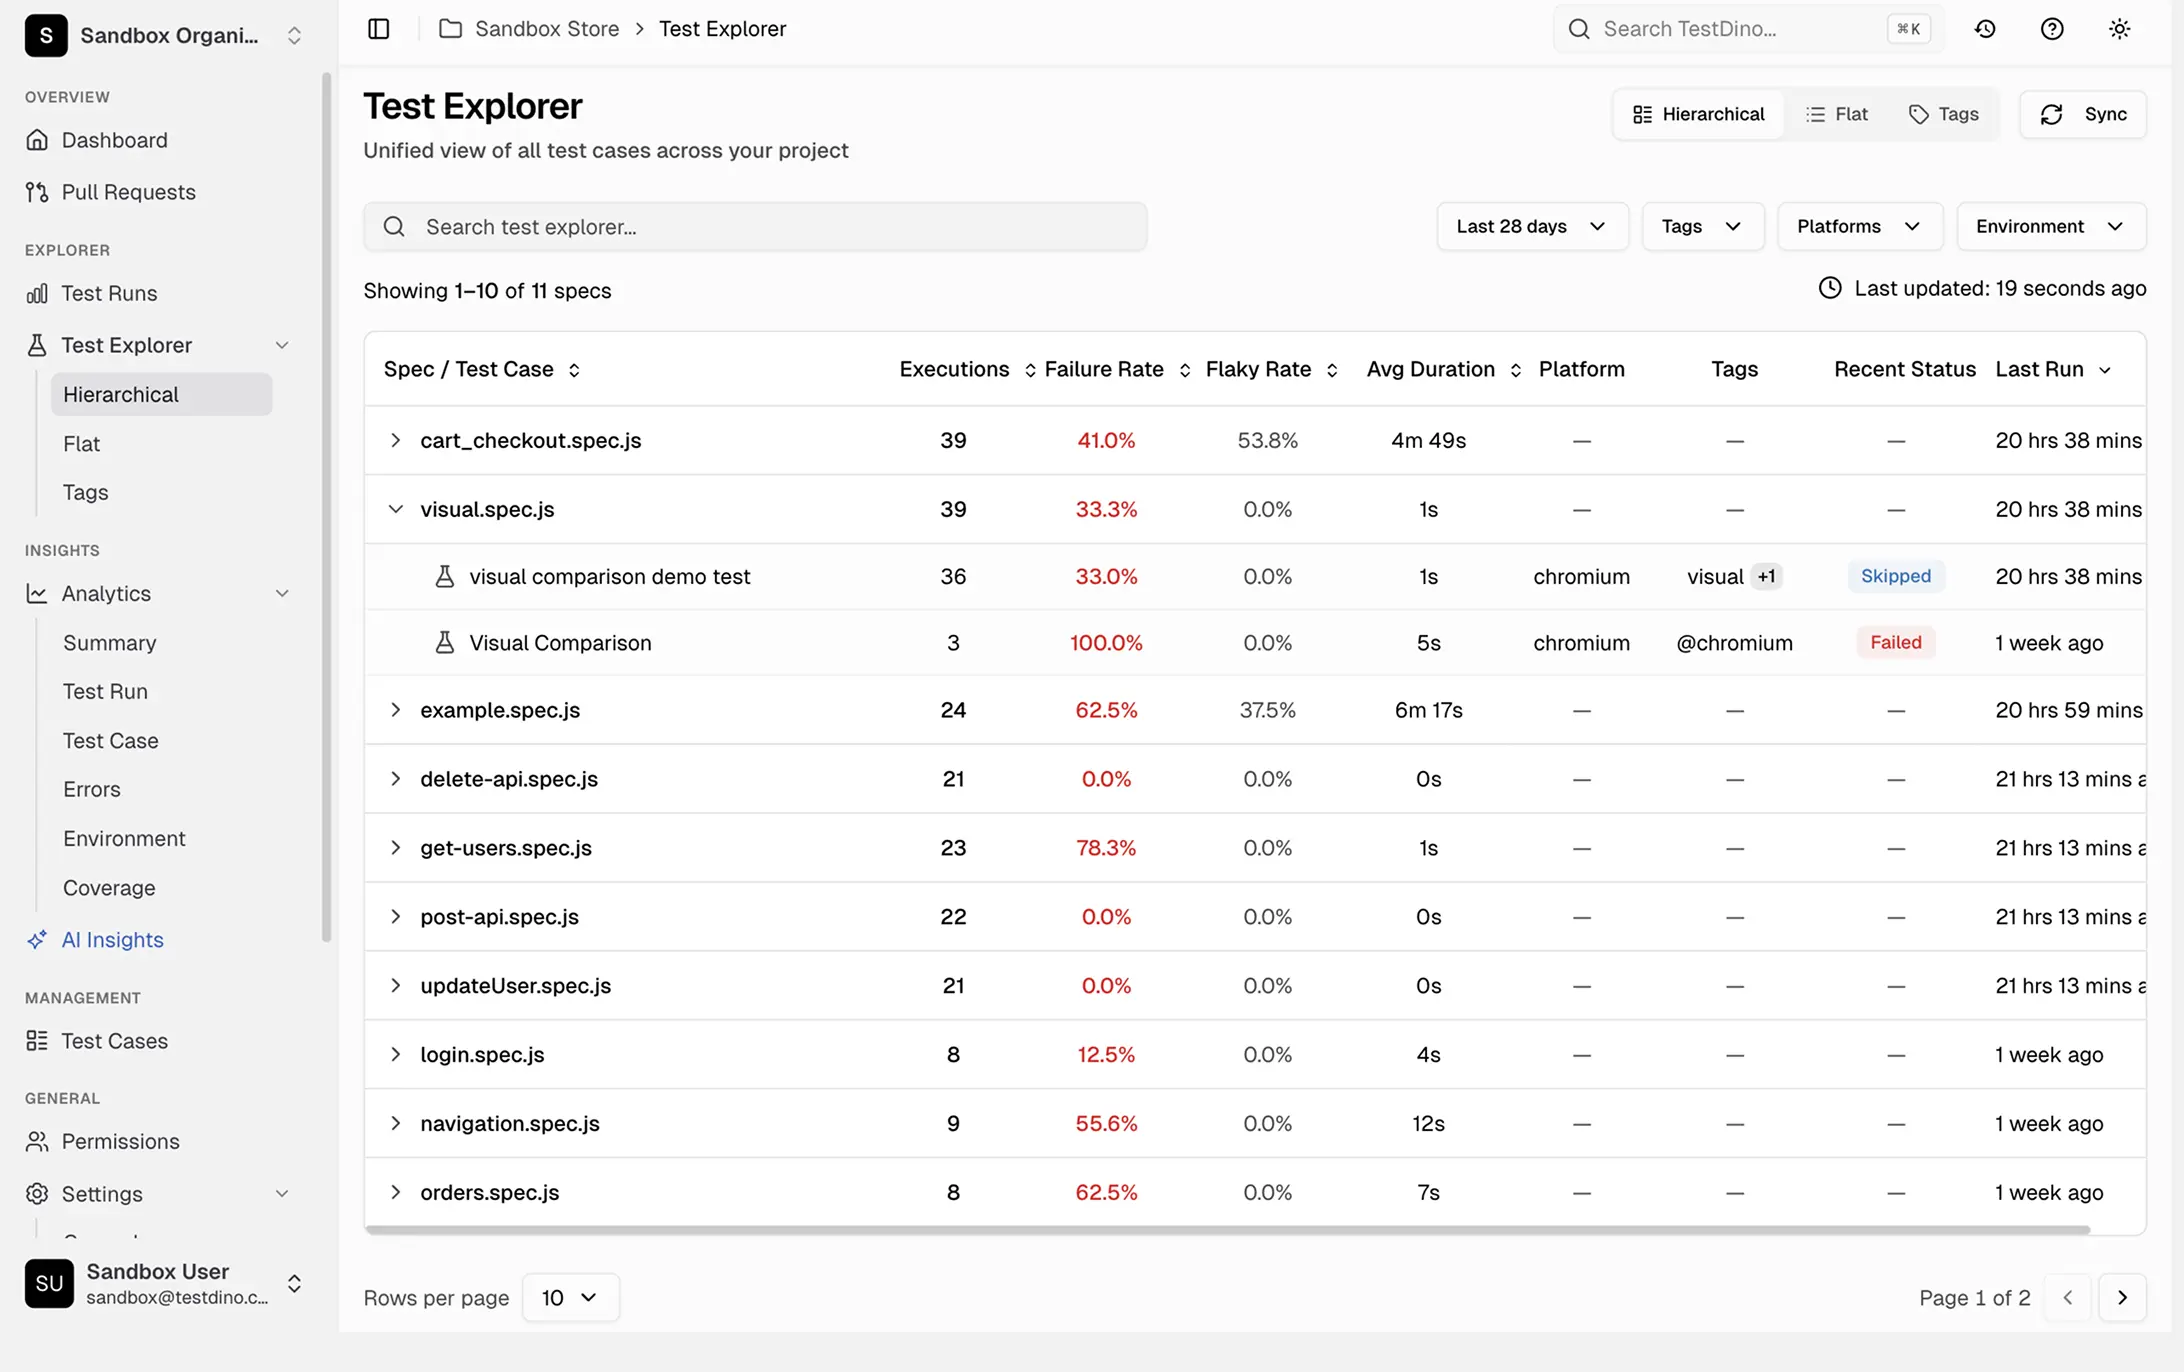
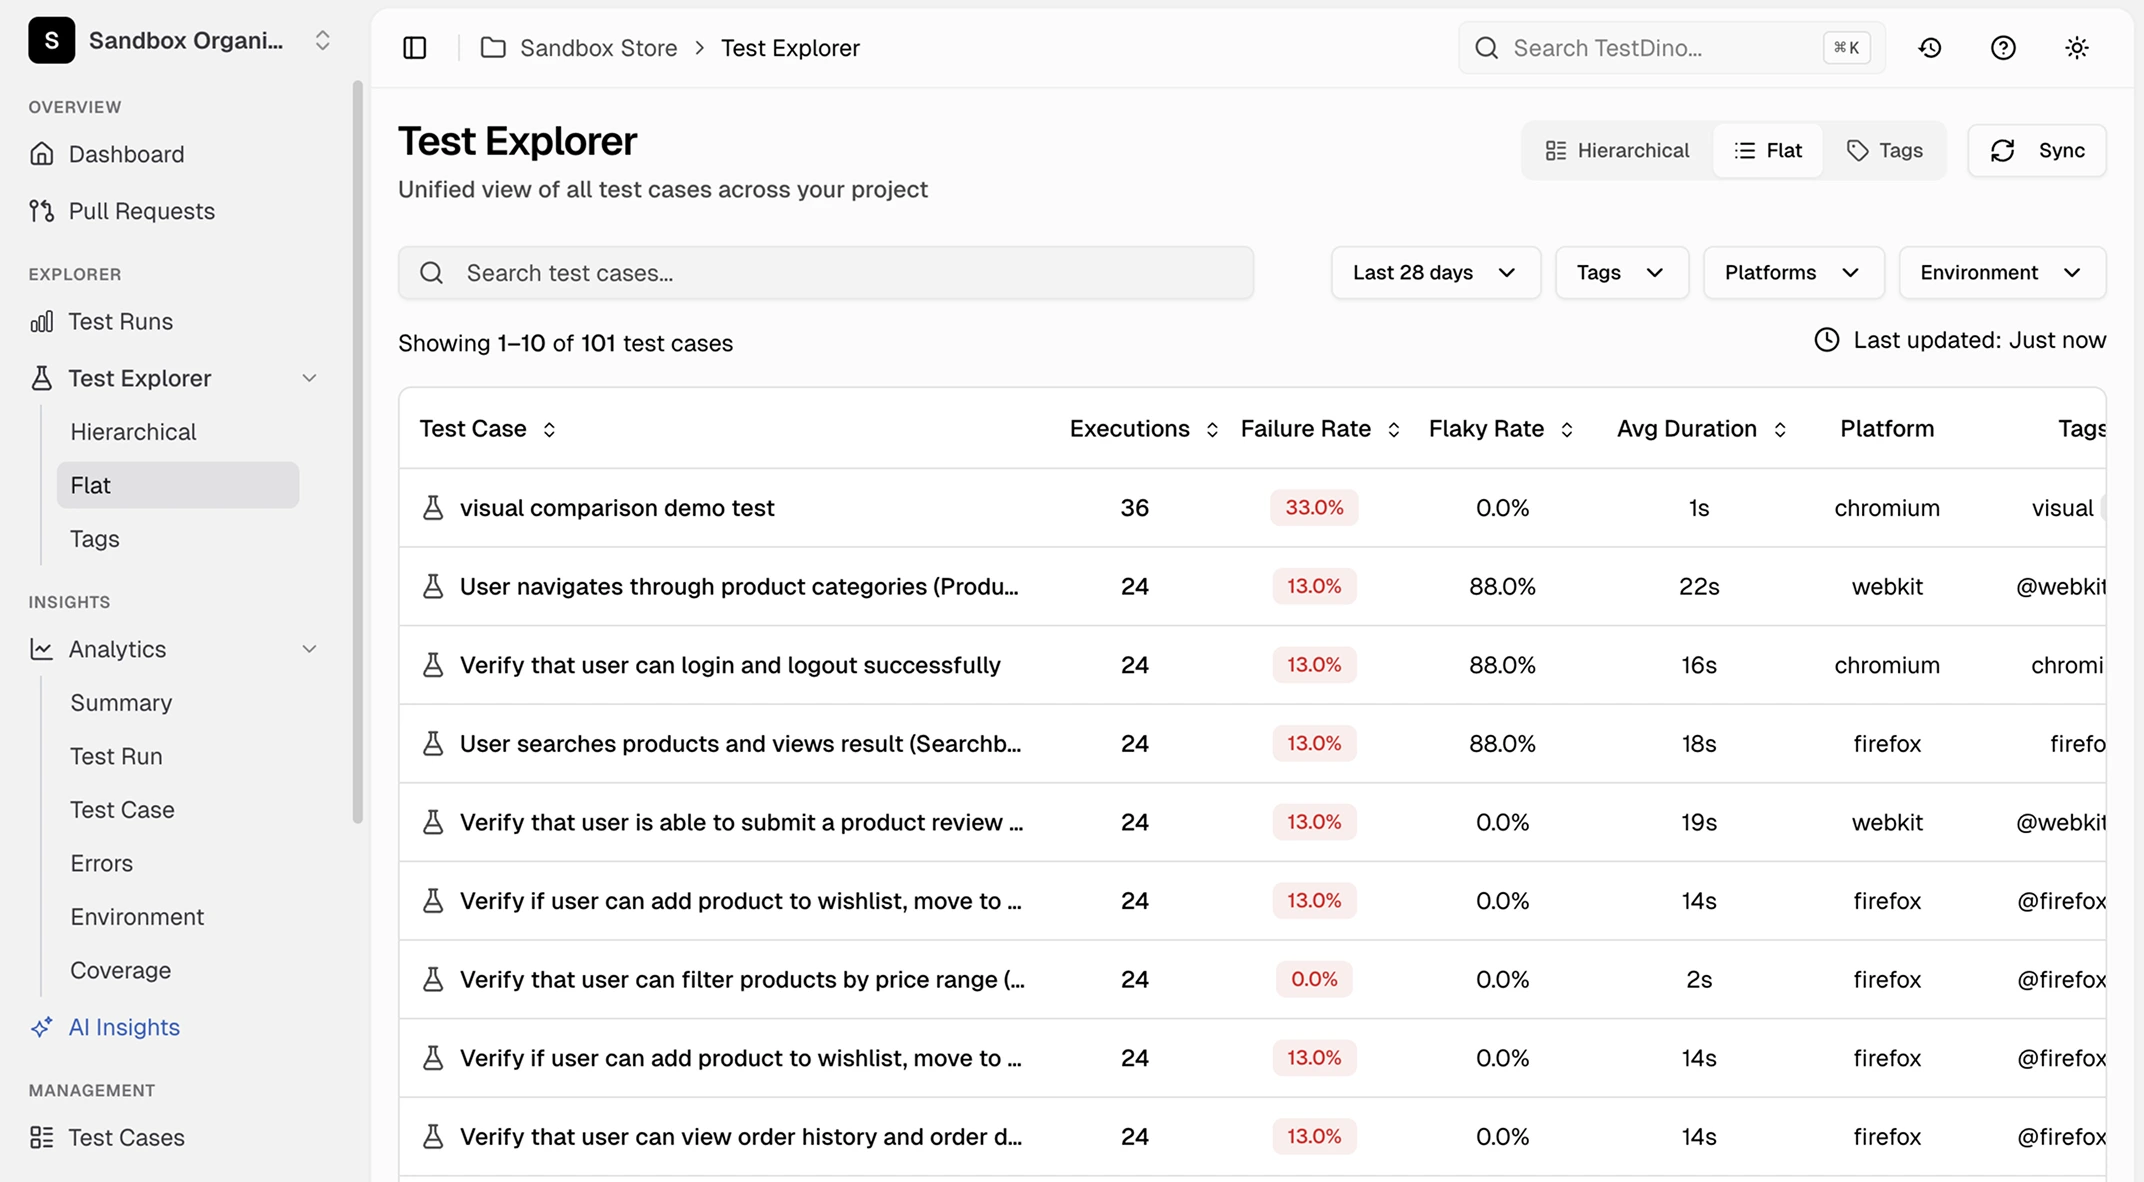
Browse specs and tests
Click a test to inspect
How the test explorer works
TestDino aggregates results across every run to build spec-level and test-level health metrics. Sort, filter, and drill down to understand exactly where your suite needs work.
Add the TestDino reporter
One line in your Playwright config. The test explorer starts building health metrics for every spec file and test case from your very first run.

reporter: [
  ['html', { outputDir: './playwright-report' }],
  ['json', { outputFile: './playwright-report/report.json' }],
]
npx tdpw upload <report-dir> --token=$TESTDINO_API_KEY
Metrics aggregate across runs
After each run, TestDino recalculates pass rates, flaky rates, average durations, and failure counts for every spec file and individual test case. The more runs you have, the more accurate the picture.

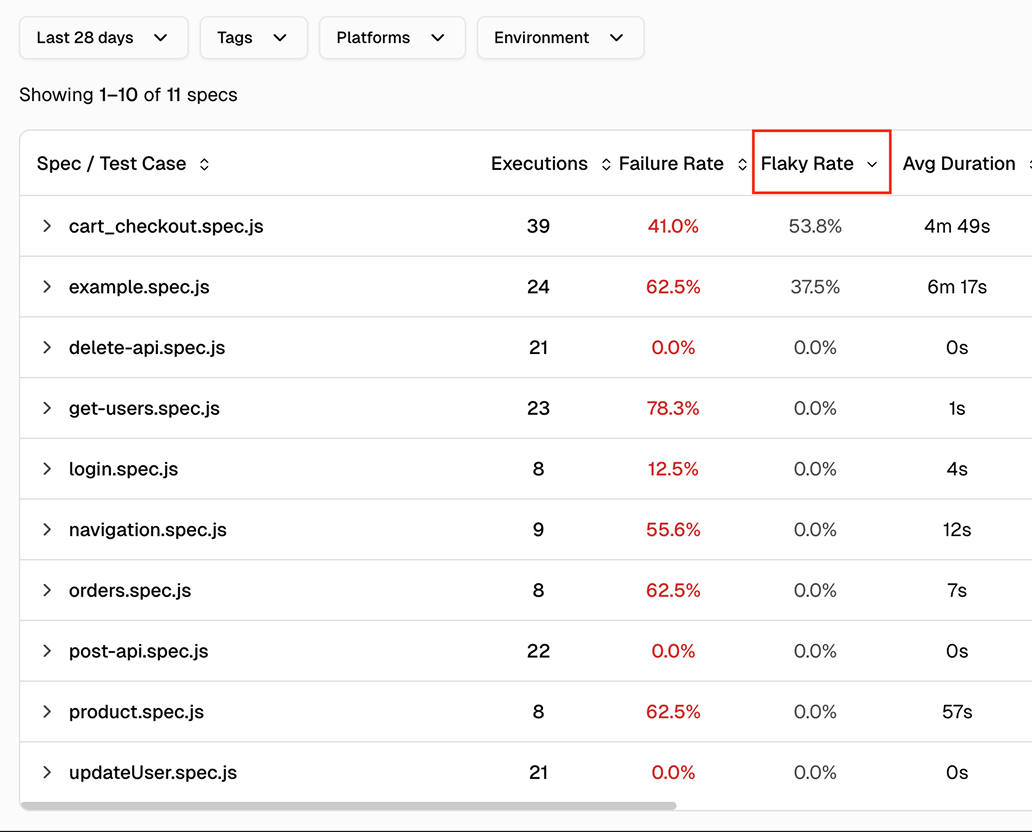
Sort specs to find problems
Open the test explorer and sort spec files by flaky rate to find unstable areas. Sort by duration to find slow specs eating CI time. Click into any spec to see the same metrics at the individual test level.
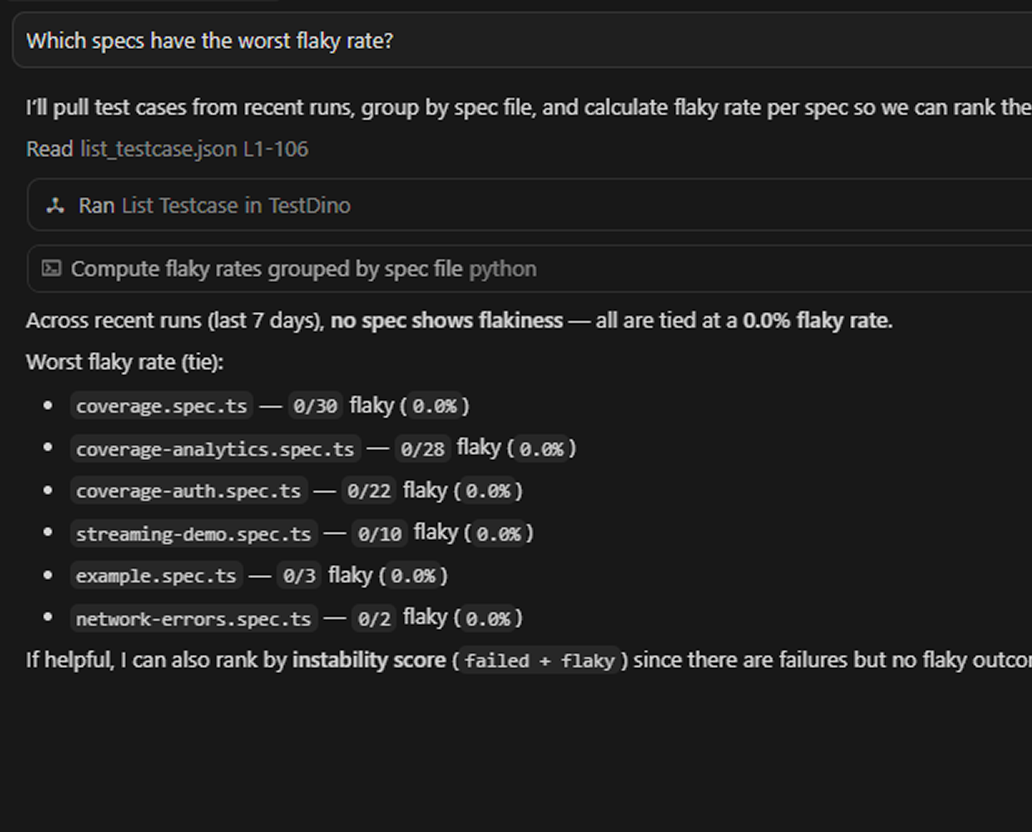
Explore test data via MCP
Connect the TestDino MCP server to your editor and pull recent failures by tag, spec file, or status, and inspect individual test case history without opening the dashboard.
Teams love what we built
See why developers choose TestDino to ship faster and debug smarter
Over 30 flaky tests and no structured way to track them, just CI artifacts and morning guesswork. TestDino's "Most Flaky Tests" feature broke this pattern. We can see failure trends now and pull up video recordings of exactly what went wrong. The TestDino MCP server is the magic piece on top, I ask my Claude agent about a failure and it pulls full context from TestDino without switching tabs. We went from 30-something flaky tests down to 3 or 4.
Fewer flaky test reruns
Faster failure triage

Migrating to TestDino from Currents was an easy decision. The features are stronger, the cost is lower, and the interface makes debugging far less painful. Flaky test detection and AI failure classification have simplified debugging and reduced our CI costs by cutting down reruns and noisy failures.
Reduction in CI costs
Less time triaging failures

Spec-level and test-level
health metrics at a glance
Spec-level health metrics
Each spec file shows executions, failure rate, flaky rate, average duration, platform, tags, recent status, and last run timestamp in sortable columns.
Individual test case drill-down
Click any spec file to view health metrics for each test case inside it and spot what lowers your pass rate.
Sortable columns for prioritization
Sort spec files by flaky rate, pass rate, duration, or failure count. The worst offenders surface immediately.
Trend lines over time
Pass rates and flaky rates are tracked over time so you can confirm whether your suite is stabilizing or regressing.
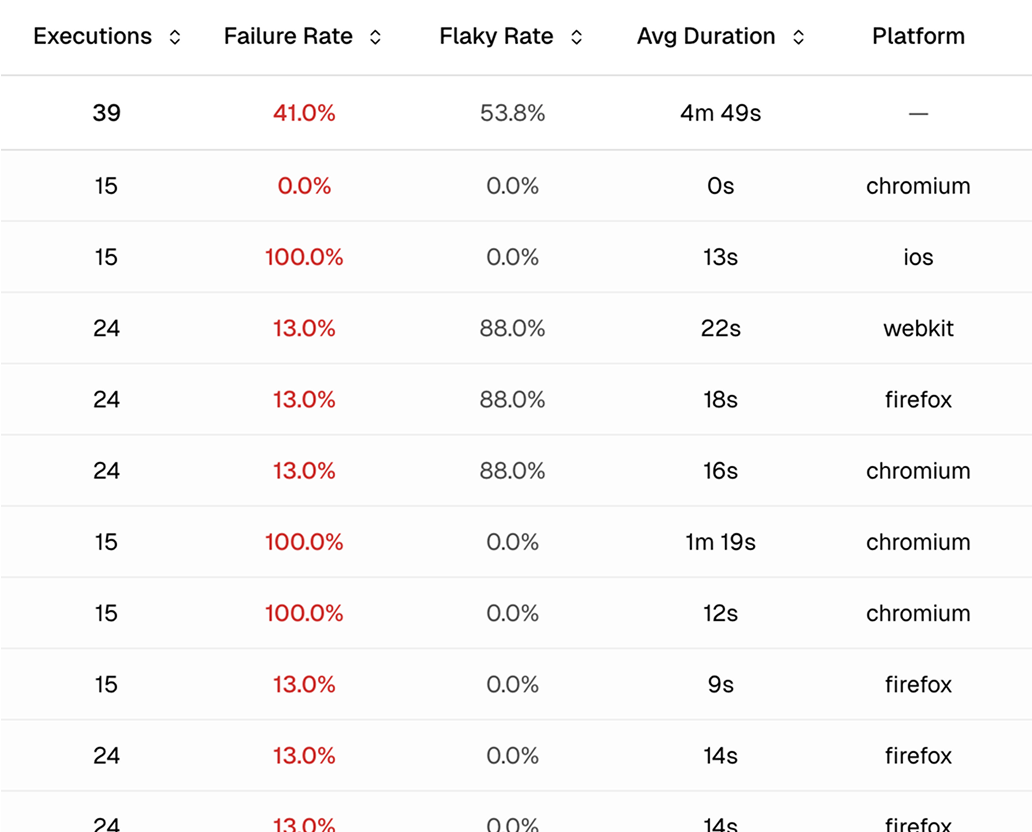
Duration tracking per spec and test
Average execution duration for every spec and test case. Identify tests taking too long and specs with creeping duration.
Filter by time period, environment, and platform
Scope metrics to the last 7, 14, 30, 60, or 90 days. Filter by environment, browser, or tags. Use regex search to find specific spec files or test titles.
What you get with the test explorer
Health metrics from spec-level overview to individual test cases.
Individual test case metrics
Drill into any spec file to see the same health metrics for every test case inside it. The test-level view shows you exactly where the problem is so you fix the right thing instead of refactoring the whole spec.
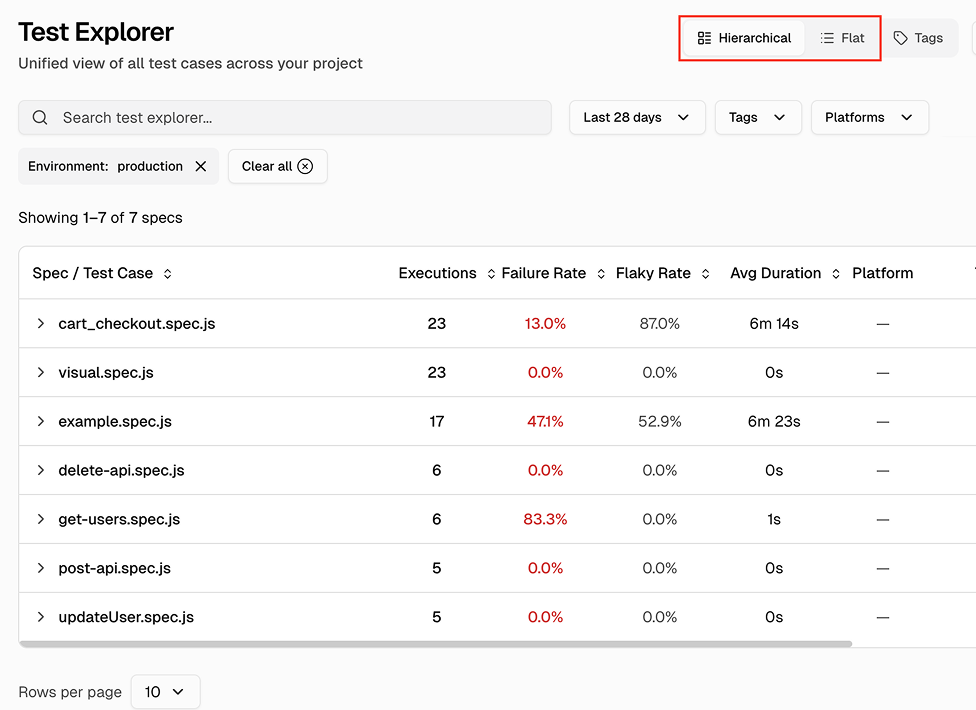
Hierarchical and flat views with sortable columns
Switch between a hierarchical view grouped by spec file and a flat view listing every test. Sort by executions, failure rate, flaky rate, average duration, or last run timestamp to find problems fast.
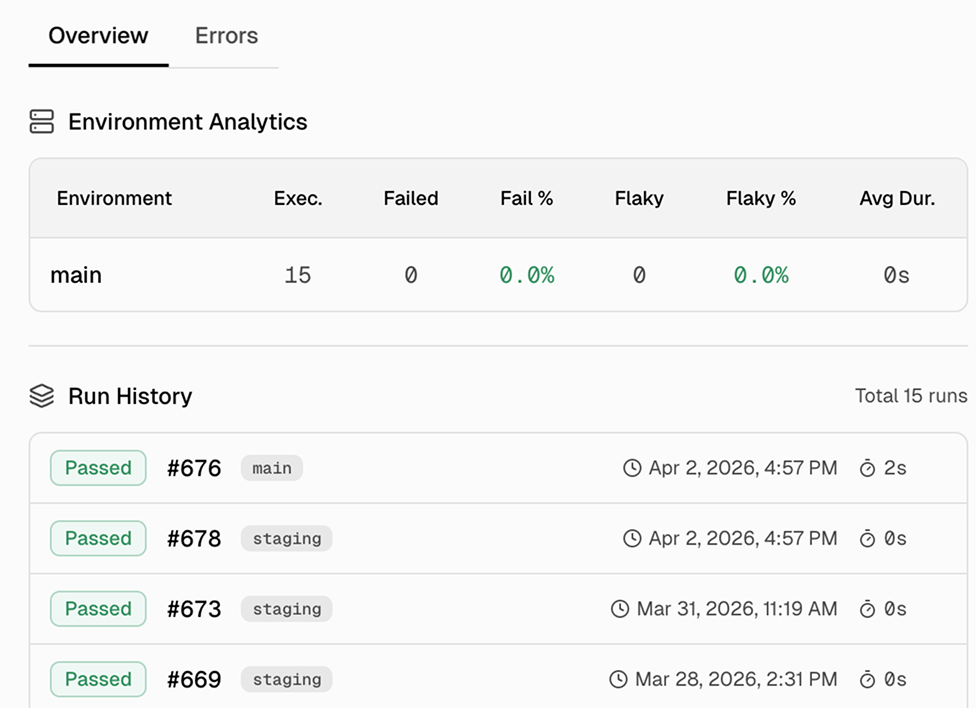
Test case details with execution history and error aggregation
Click any test to open a details drawer with two tabs. Overview shows execution history and platform/environment breakdowns. Errors shows aggregated error messages with first/last occurrence and frequency.
Works with your favourite tools
Connect seamlessly with Jira, Slack, GitHub, Linear, Azure DevOps, Asana, and monday to keep your workflow smooth and your team aligned.
FAQs
You get basic pass/fail data from your first run. After 5-10 runs, flaky rates and pass rates become statistically meaningful. Most teams see a reliable health picture within their first week.