Stop building test reports by hand every Monday.
Polished PDF reports on a schedule you define, delivered to your team with trends and flakiness scores.

Your team still assembles
test reports manually
Someone asks for the numbers and you spend an hour pulling data from three dashboards.

Status updates you can't prepare for
Every standup or sprint review turns into a scramble. You screenshot CI output, paste it into a doc, and hope nobody asks a follow-up question about trends.
Failure trends are invisible until production breaks
Without a recurring summary, nobody notices that login tests have been failing 15% more each week. The trend only becomes obvious after a customer reports it.
Flakiness data lives in CI logs nobody reads
Your CI pipeline produces thousands of lines of output. The flaky test signal is buried in there somewhere, but no one has time to dig through raw logs regularly.
Stakeholders don't have access to your test dashboards
Product managers, engineering leads, and QA directors need visibility into test health, but they're not going to log into your CI tool every day. PDFs go where dashboards can't.
How automated PDF reports work
Connect your Playwright suite once. TestDino collects every run, compiles the data, and delivers formatted reports on the cadence you choose.
Add the TestDino reporter
One line in your Playwright config. Every test result flows into the platform automatically from your first run.

reporter: [
  ['html', { outputDir: './playwright-report' }],
  ['json', { outputFile: './playwright-report/report.json' }],
]
npx tdpw upload <report-dir> --token=$TESTDINO_API_KEY
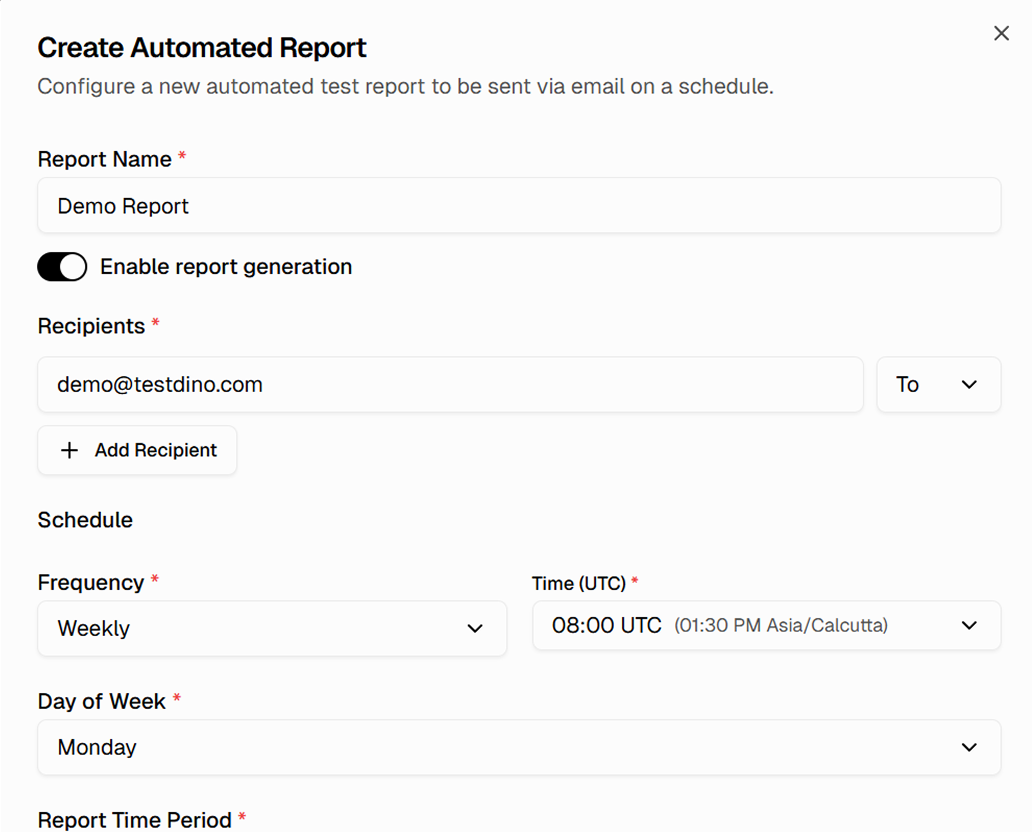
Set your report schedule
Choose daily, weekly, or monthly delivery. Pick which environments and test suites to include. Set the recipient list - stakeholders get reports without needing dashboard access.

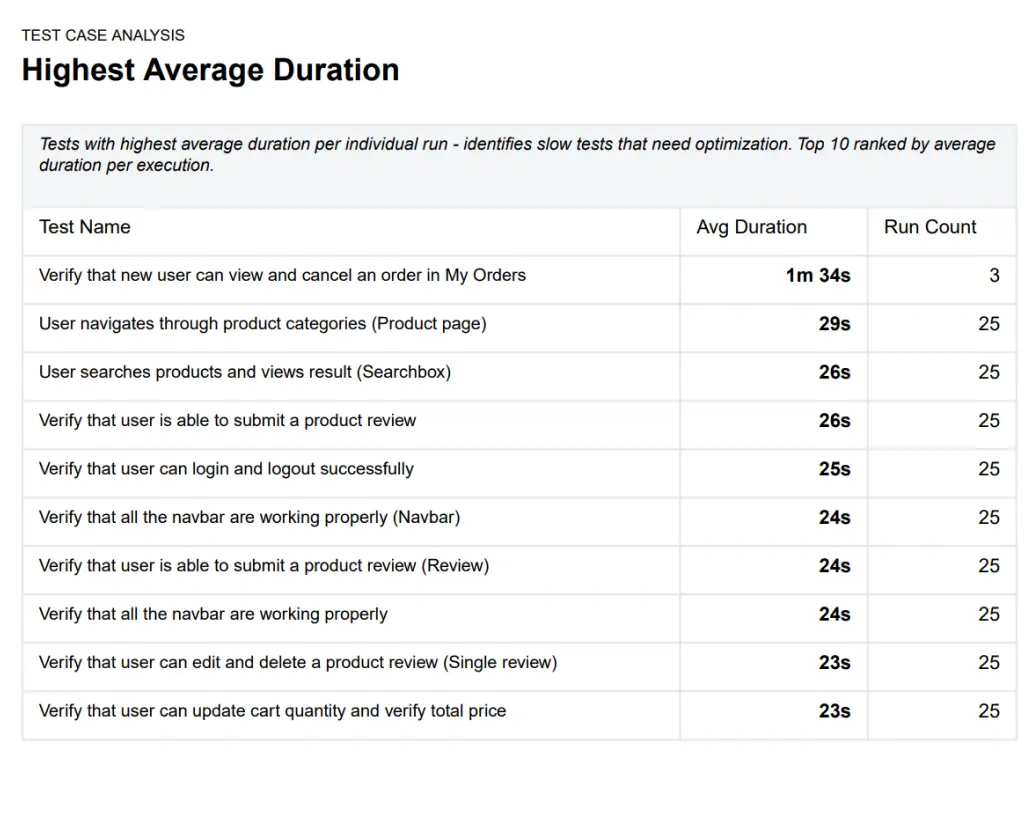
Review the generated report
Each report includes an executive summary, test case analysis, branch statistics, and trend graphs. Everything your stakeholders need in one document.
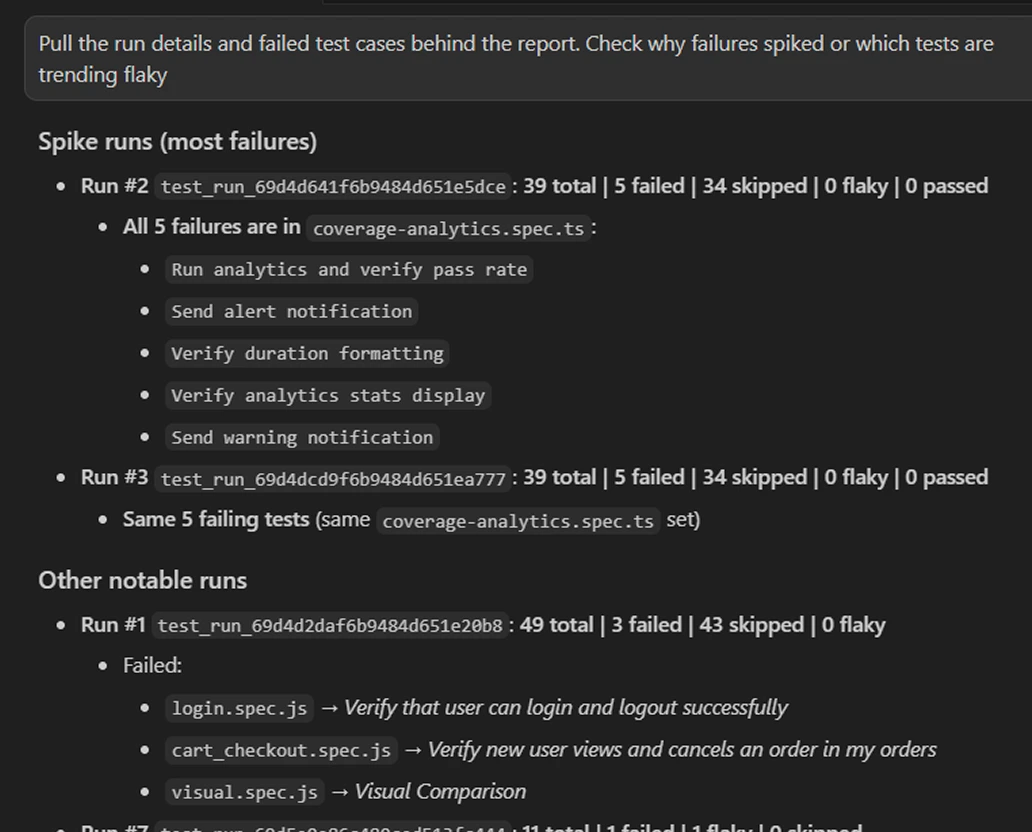
Let your AI agent analyze report data
Connect TestDino's MCP server to Cursor, Claude Code, or Copilot. Your AI agent pulls run details and failure trends behind the report, checks why failures spiked, and flags flaky tests without you opening the dashboard.
Teams love what we built
See why developers choose TestDino to ship faster and debug smarter
Over 30 flaky tests and no structured way to track them, just CI artifacts and morning guesswork. TestDino's "Most Flaky Tests" feature broke this pattern. We can see failure trends now and pull up video recordings of exactly what went wrong. The TestDino MCP server is the magic piece on top, I ask my Claude agent about a failure and it pulls full context from TestDino without switching tabs. We went from 30-something flaky tests down to 3 or 4.
Fewer flaky test reruns
Faster failure triage

Migrating to TestDino from Currents was an easy decision. The features are stronger, the cost is lower, and the interface makes debugging far less painful. Flaky test detection and AI failure classification have simplified debugging and reduced our CI costs by cutting down reruns and noisy failures.
Reduction in CI costs
Less time triaging failures

What automated reports reveal
about your test suite
Execution summary with pass/fail/skip breakdown
Total runs, durations, and outcomes at a glance, showing whether a suite is healthy or degrading over the reporting period.
Failure trend analysis over time
Failure rates tracked across days, weeks, or sprints with clear trend lines, helping you spot regressions before they hit production.
Flakiness scoring per test
Each test gets a flakiness score based on its pass/fail pattern, identifying the noisiest tests without manual log analysis.
Environment-level comparisons
Test health compared across staging, production, and feature branches in one report, showing where most failures originate.
Slowest test breakdown
Tests ranked by duration so you can find the ones dragging down your CI pipeline and prioritize optimization.
Historical trend charts
Week-over-week and month-over-month charts give leadership a high-level view of test suite health without dashboard access.
What you get with PDF reports
Stakeholder-ready reports delivered on schedule with zero manual effort.
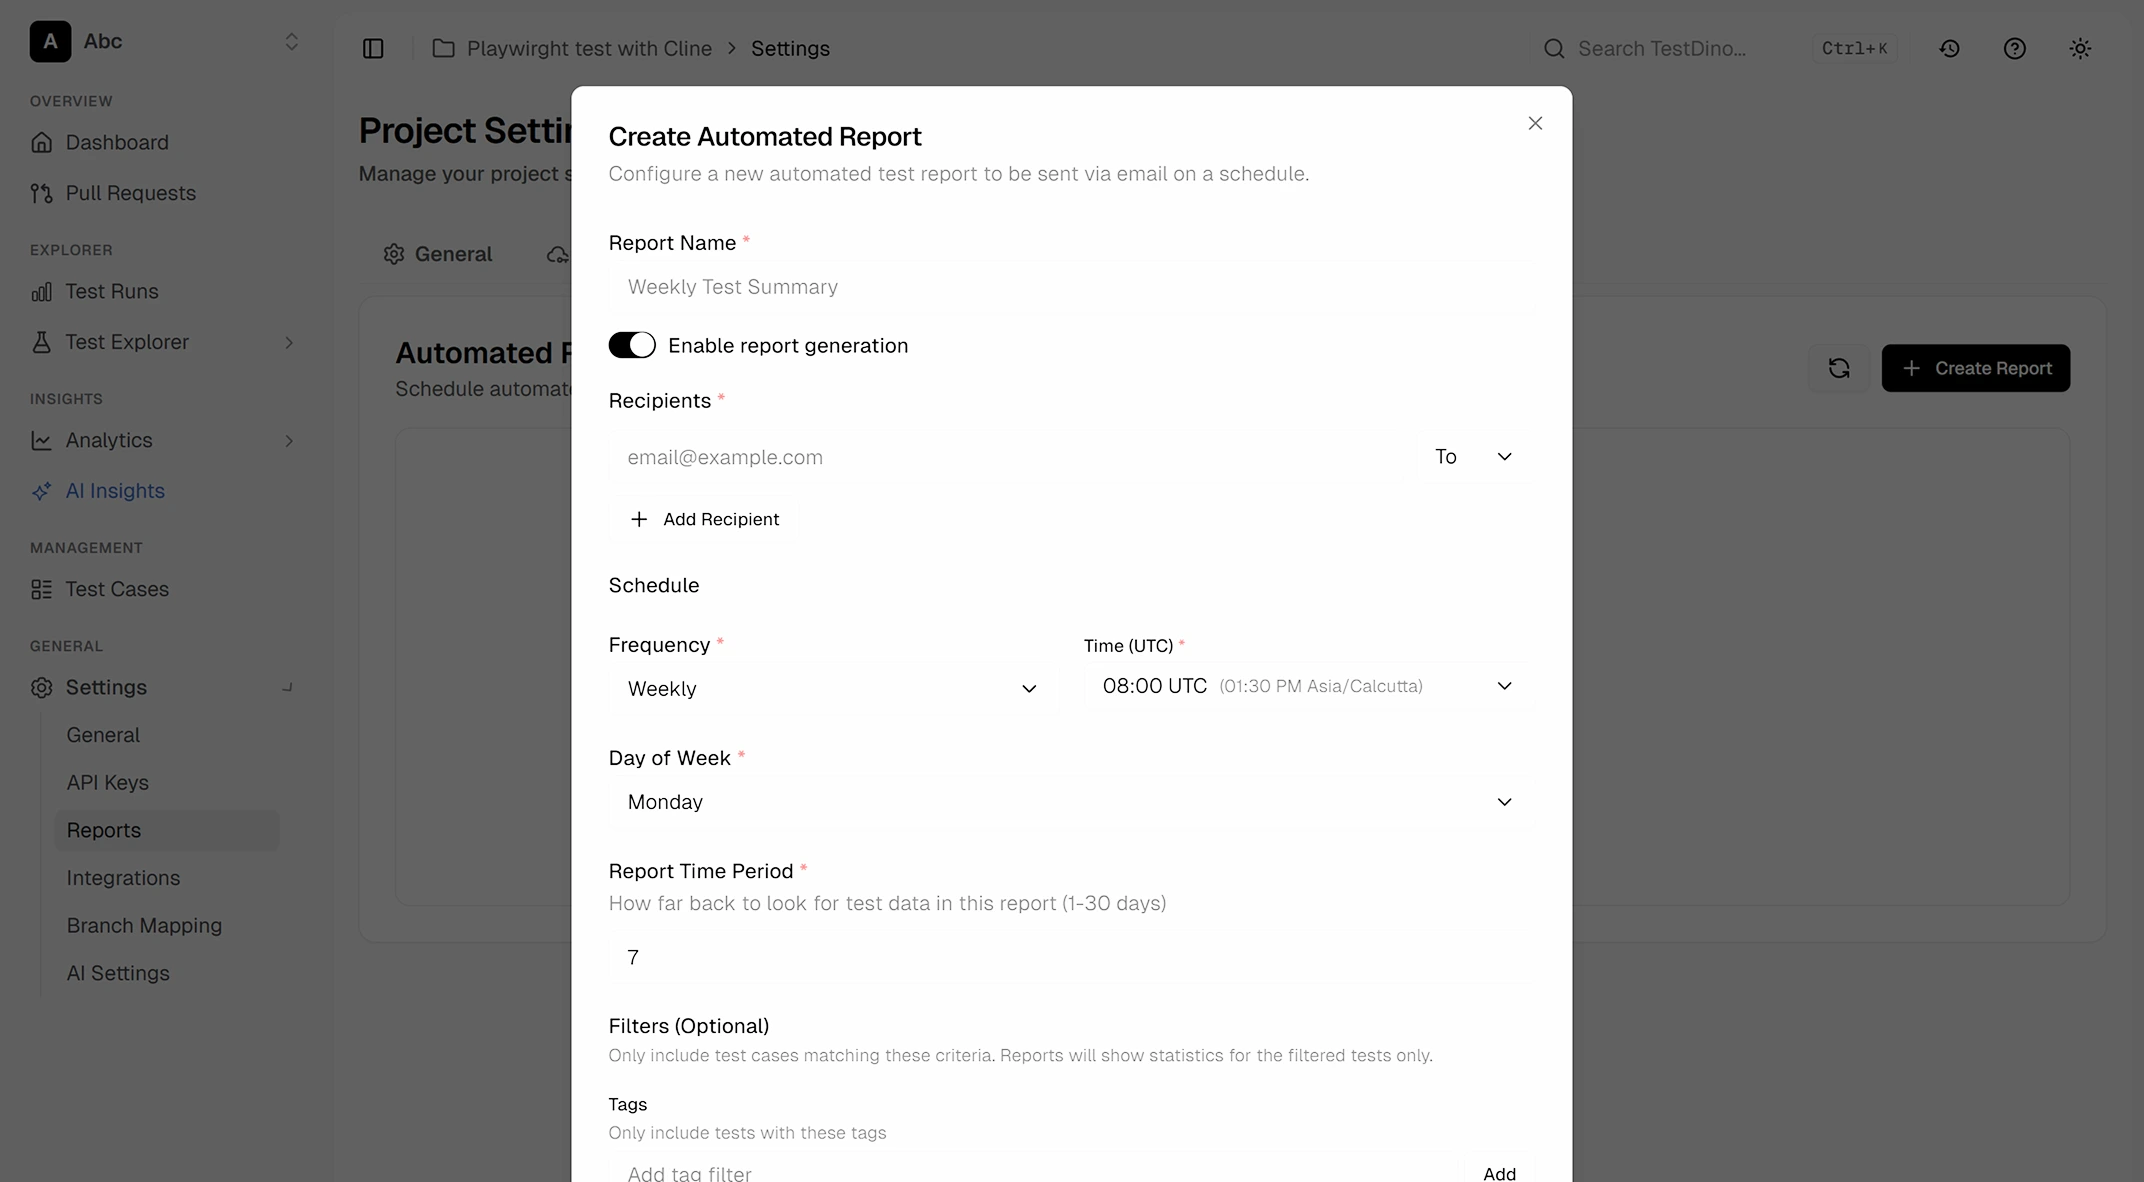
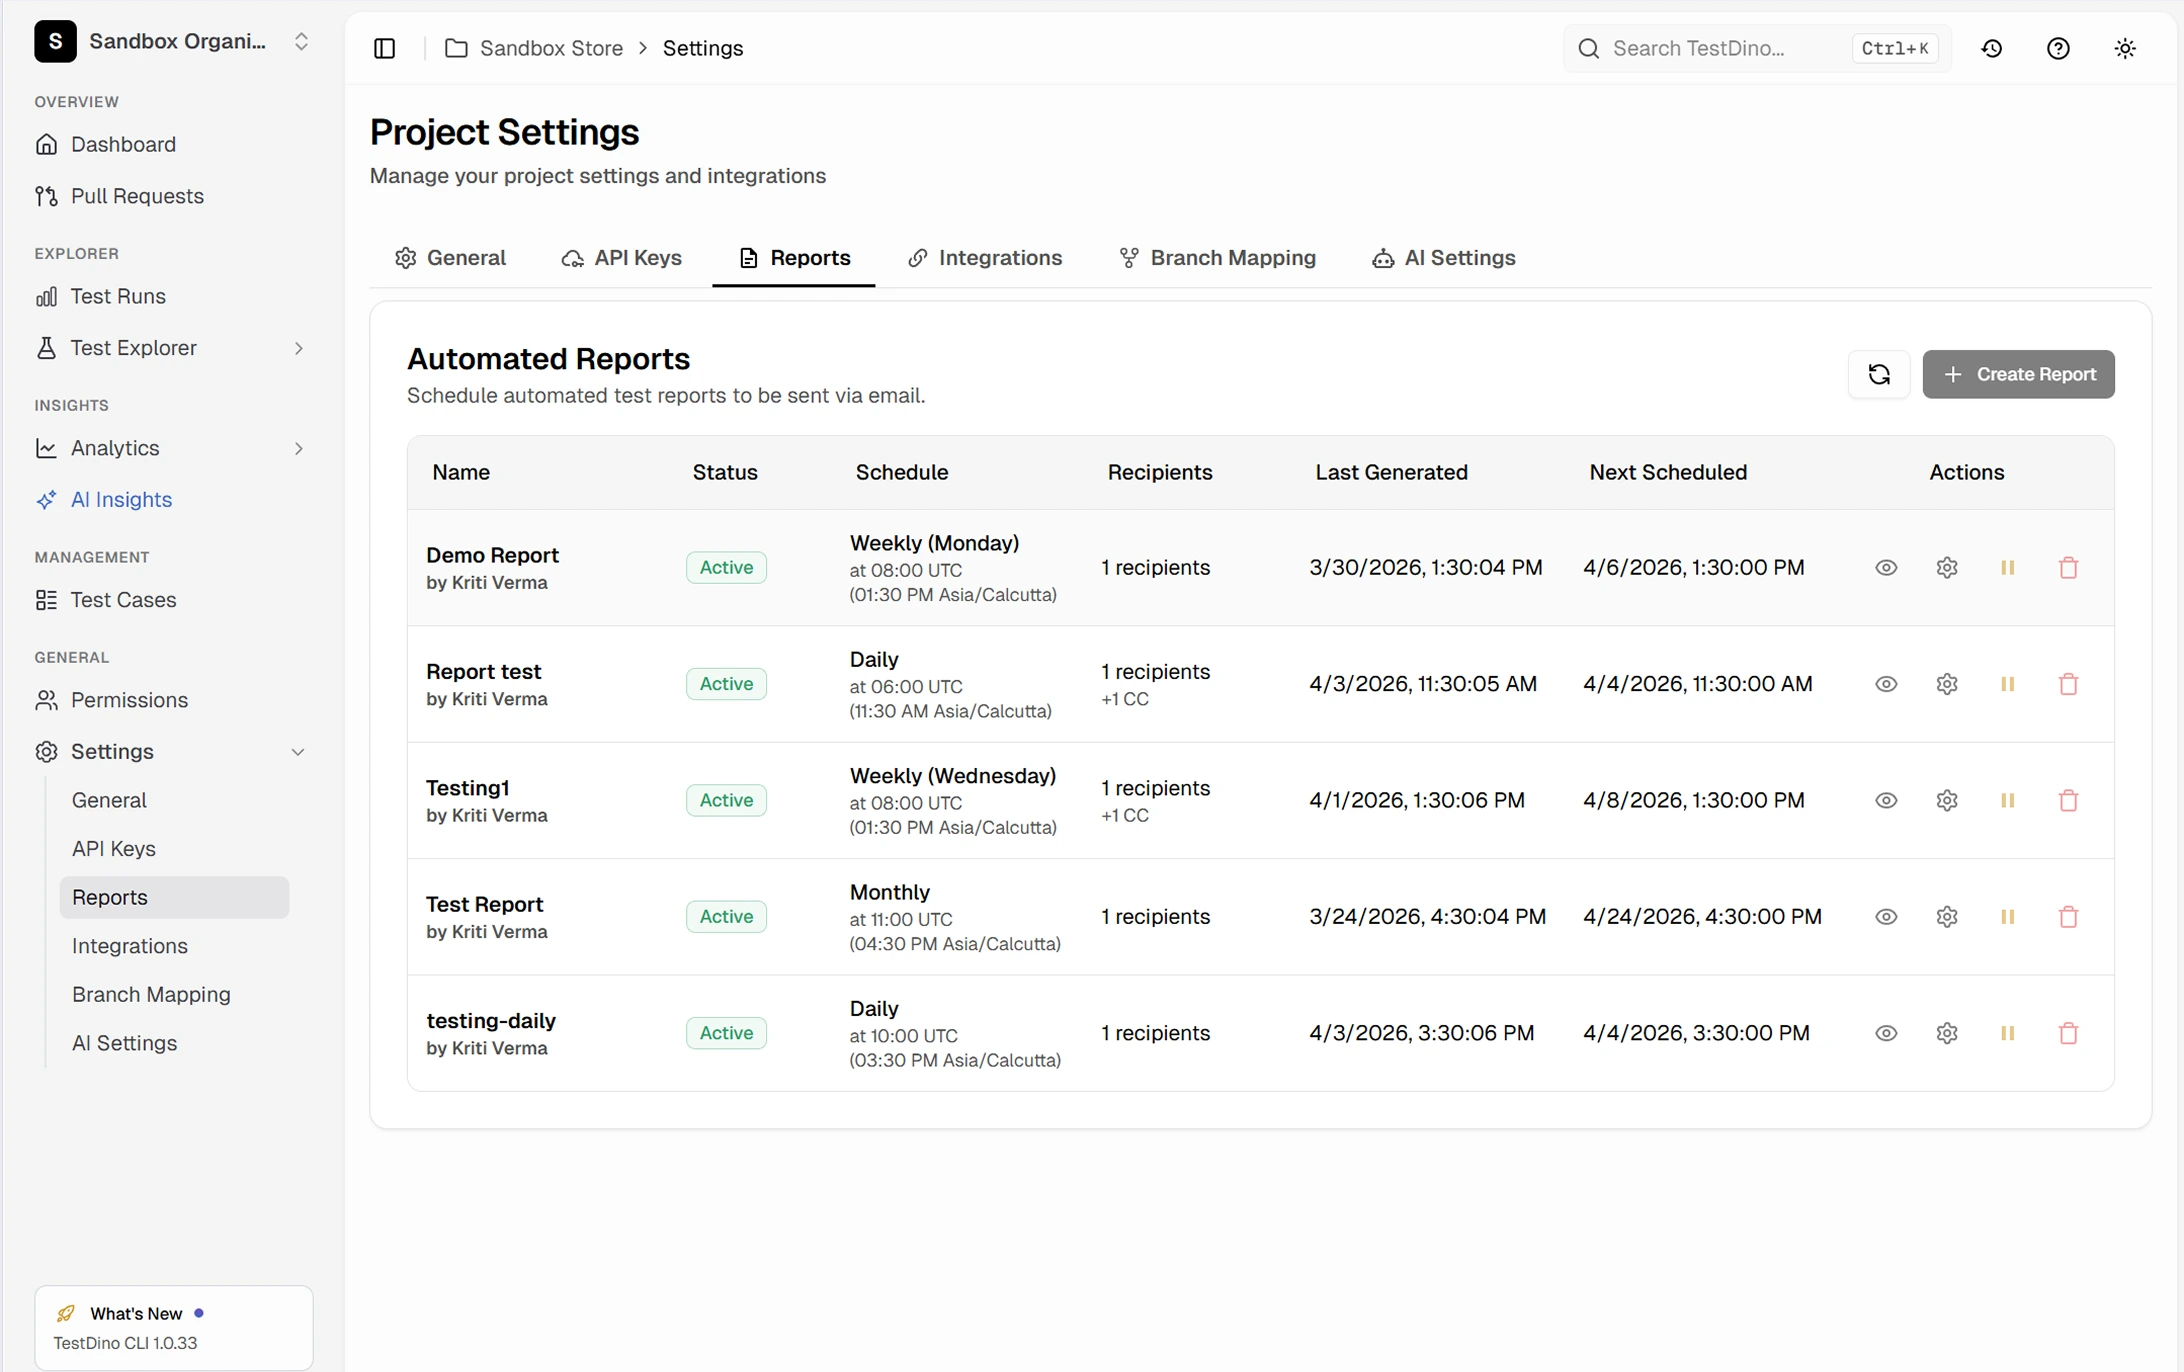
Full delivery control
Choose who receives each report, how often, and which data it includes. Run separate schedules for different teams or environments, then adjust everything from the dashboard.
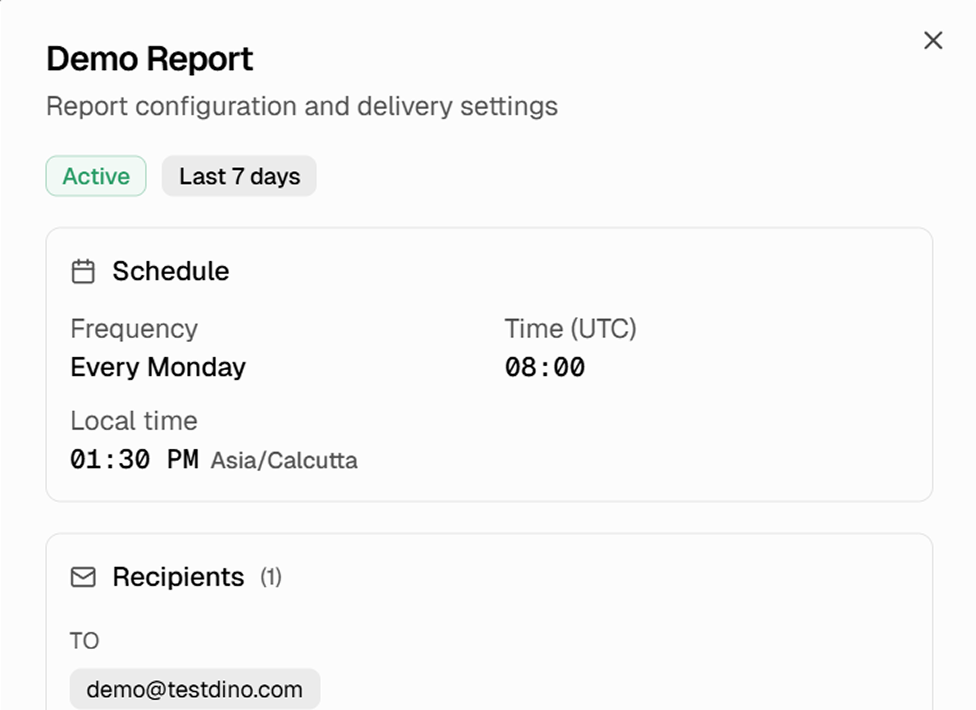
Full report configuration at a glance
Each report shows its schedule, frequency, delivery time, recipient list, and environment filters in one view. Preview what is set, pause or resume delivery, and download the PDF directly from the settings page.
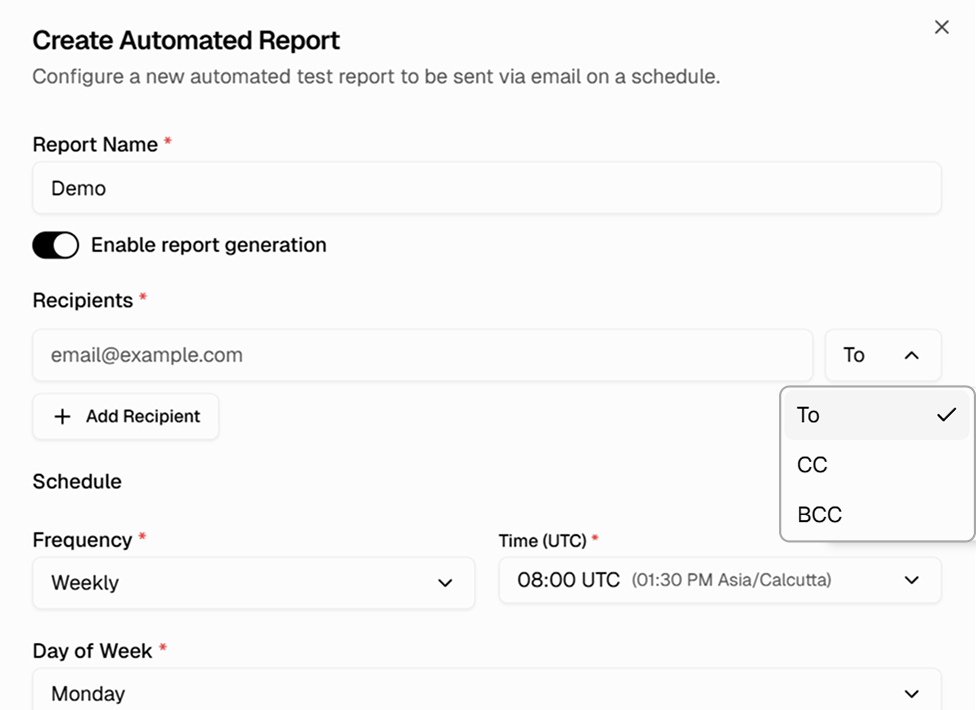
Recipients with To, CC, and BCC designation
Add multiple recipients per report and control visibility with To, CC, and BCC fields. Send a staging-focused report to QA and a production-focused report to leadership, each with its own recipient list.
Works with your favourite tools
Connect seamlessly with Jira, Slack, GitHub, Linear, Azure DevOps, Asana, and monday to keep your workflow smooth and your team aligned.
FAQs
Every report includes an executive summary, test case analysis, branch statistics, and trend graphs. Daily reports cover the last 24 hours, weekly reports cover the last 7 days.