Understand any test run in 5 minutes, not 30.
Error grouping, run comparison, spec file breakdown, and configuration metadata for every Playwright run.

Playwright HTML reports break
down past 100 tests
800 tests across 60 spec files and the HTML report is a static page with no analysis.

The HTML report is a flat list with no analysis
Playwright's default reporter gives you pass/fail counts and a list of results. No error grouping, no trend comparison, no way to tell which failures are new vs recurring.
No run-over-run history
You can see today's results but can't compare them to yesterday's without saving the old HTML report and opening it side by side. No way to know if a test was flaky last week too.
Spec file and error relationships are invisible
When three spec files fail with the same error, you want to know immediately. But the HTML report lists each failure individually - you manually scan 40 failures to find the pattern.
Configuration and environment data is disconnected
Which browser ran this test? Which OS? Which shard? That metadata lives in your CI config, not in the report. You context-switch between tools to understand what actually ran.
The run is done. You still need the story.
20 tests ran. Here is the result.
What went wrong and what changed.
How test run reports work
Works out of the box on your first CI run. No config, no templates, no custom reporters beyond the one-liner.
Add the TestDino reporter
One line in your Playwright config. TestDino captures every detail of your test run - results, errors, traces, configuration, timing, and metadata.

reporter: [
  ['html', { outputDir: './playwright-report' }],
  ['json', { outputFile: './playwright-report/report.json' }],
]
npx tdpw upload <report-dir> --token=$TESTDINO_API_KEY
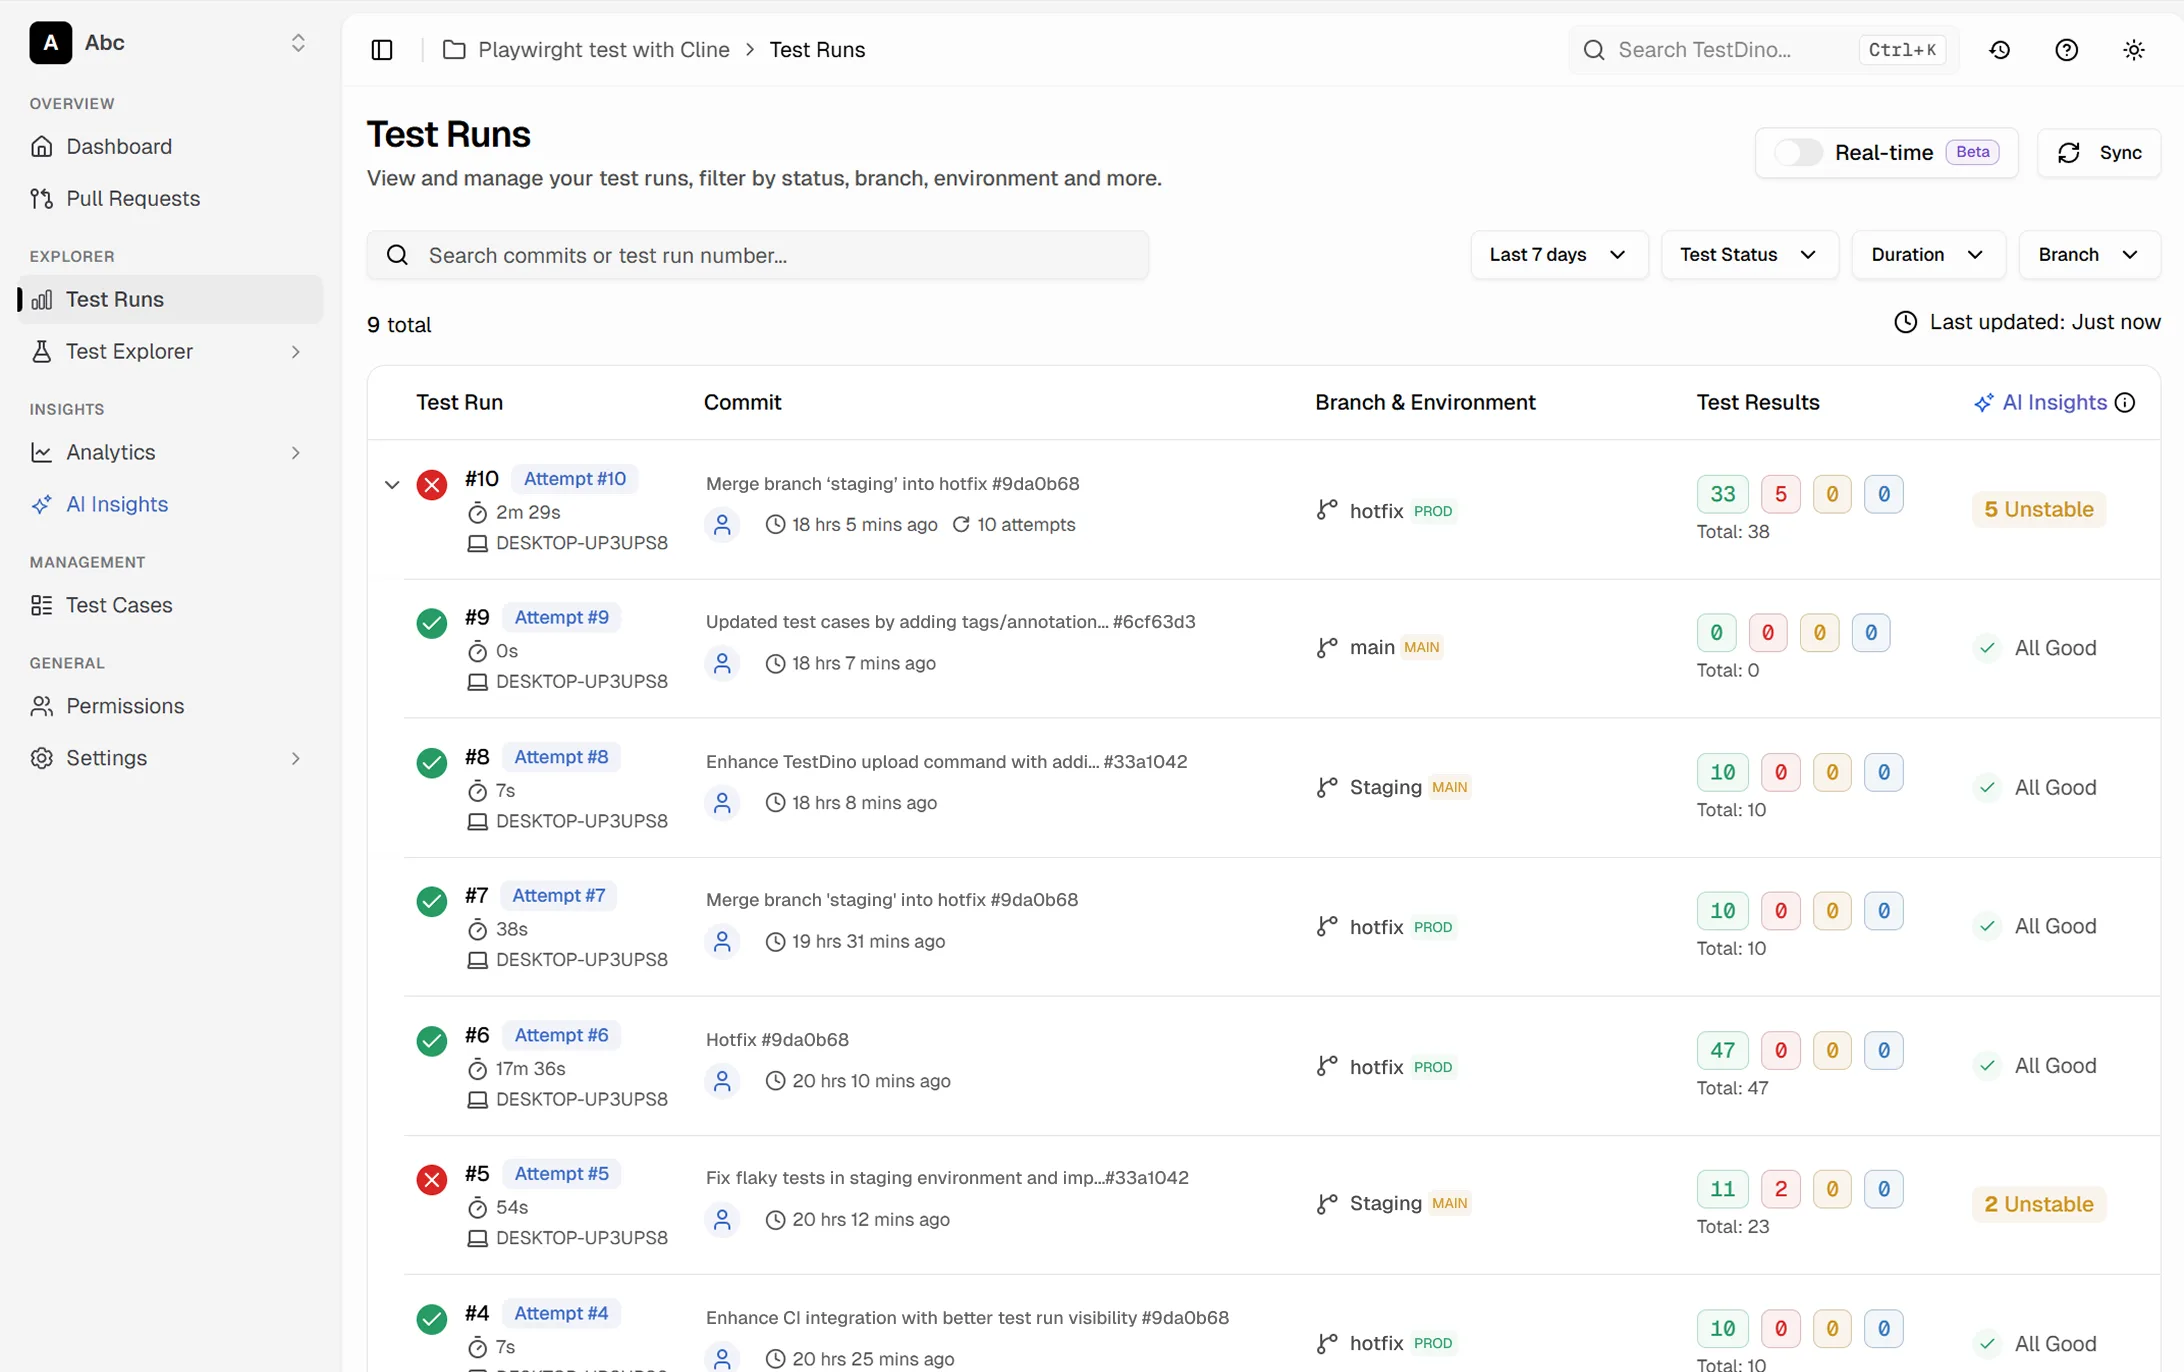
See the full picture instantly
Every test run gets its own report page with tabs: Summary, Spec Files, Errors, History, Configuration, Coverage, and AI Insights. Start with the summary for a quick health check.

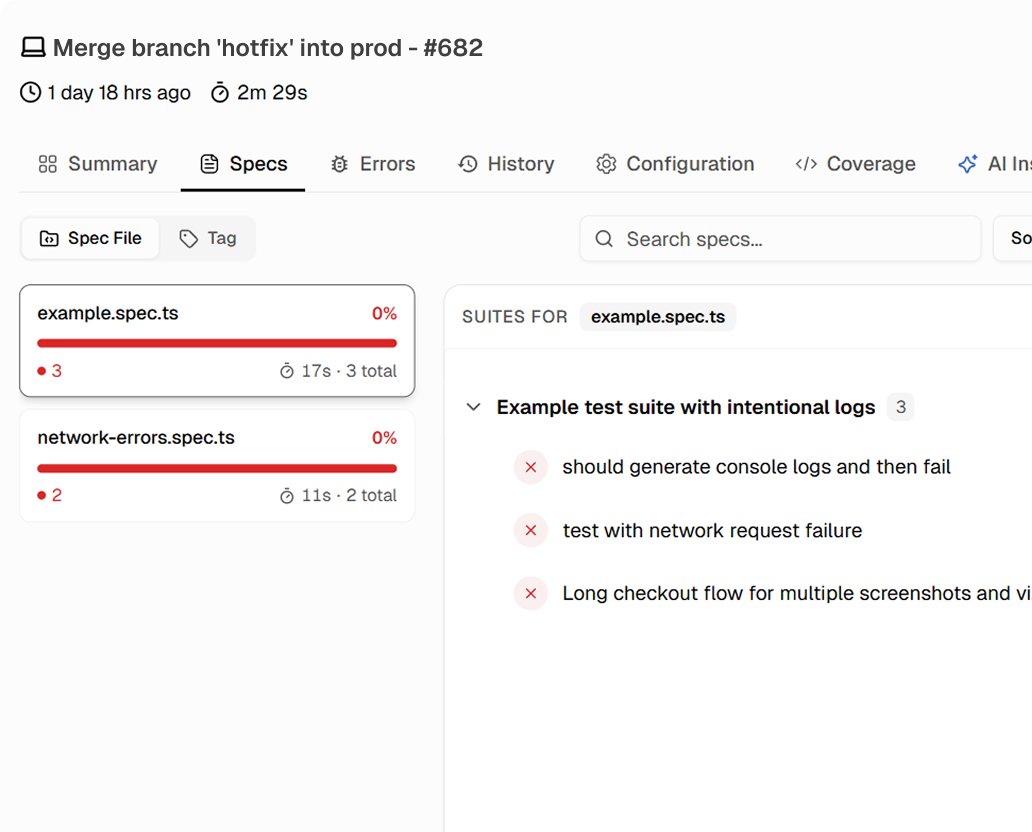
Drill into specs and errors
Click into any spec file to see its tests. Click any error group to see every test that shares that failure. Compare this run to the previous run to see exactly what changed.
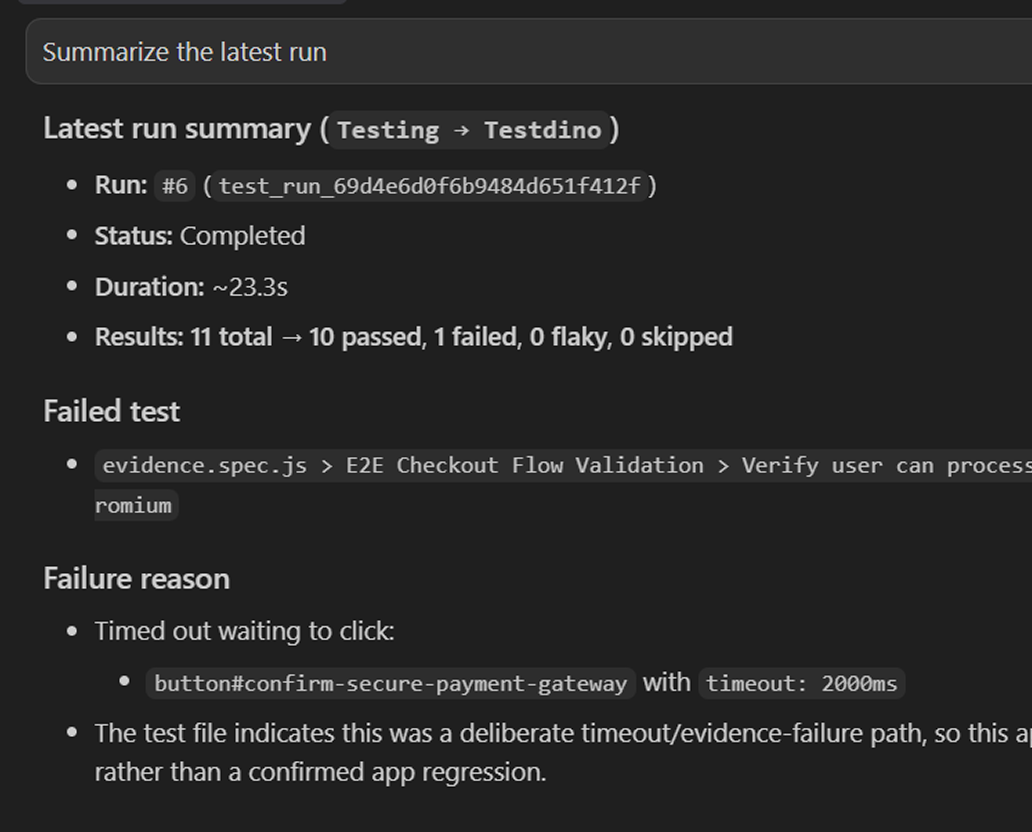
Query run data via MCP
Connect the TestDino MCP server to your editor and fetch the latest run details, failed test cases, and retry history directly, without opening the dashboard.
Teams love what we built
See why developers choose TestDino to ship faster and debug smarter
Over 30 flaky tests and no structured way to track them, just CI artifacts and morning guesswork. TestDino's "Most Flaky Tests" feature broke this pattern. We can see failure trends now and pull up video recordings of exactly what went wrong. The TestDino MCP server is the magic piece on top, I ask my Claude agent about a failure and it pulls full context from TestDino without switching tabs. We went from 30-something flaky tests down to 3 or 4.
Fewer flaky test reruns
Faster failure triage

Migrating to TestDino from Currents was an easy decision. The features are stronger, the cost is lower, and the interface makes debugging far less painful. Flaky test detection and AI failure classification have simplified debugging and reduced our CI costs by cutting down reruns and noisy failures.
Reduction in CI costs
Less time triaging failures

Understand any Playwright run
in a single page
Multi-tab run report with summary, errors, and specs
Each run has tabs for summary stats, spec file breakdown, error grouping, run history, configuration, coverage, and AI insights.
Error grouping across spec files
Failures with the same error signature are grouped automatically so you can see which tests across spec files share a root cause.
Run-over-run comparison and diff
Compare any two runs side by side to see which tests flipped status, which failures resolved, and which new ones appeared.
Full configuration and environment metadata
Every run report includes browser, OS, viewport, shard count, retry count, and CI job details. No need to open your CI pipeline.
Spec file heat map by pass rate
Spec files with low pass rates are highlighted so you can spot fragile areas and focus maintenance where it counts.
Run insights tab
Analyzes each run against recent history. Flags new regressions, recurring flaky patterns, and slowest tests.
What you get with test run reports
Complete run context in under 5 minutes.
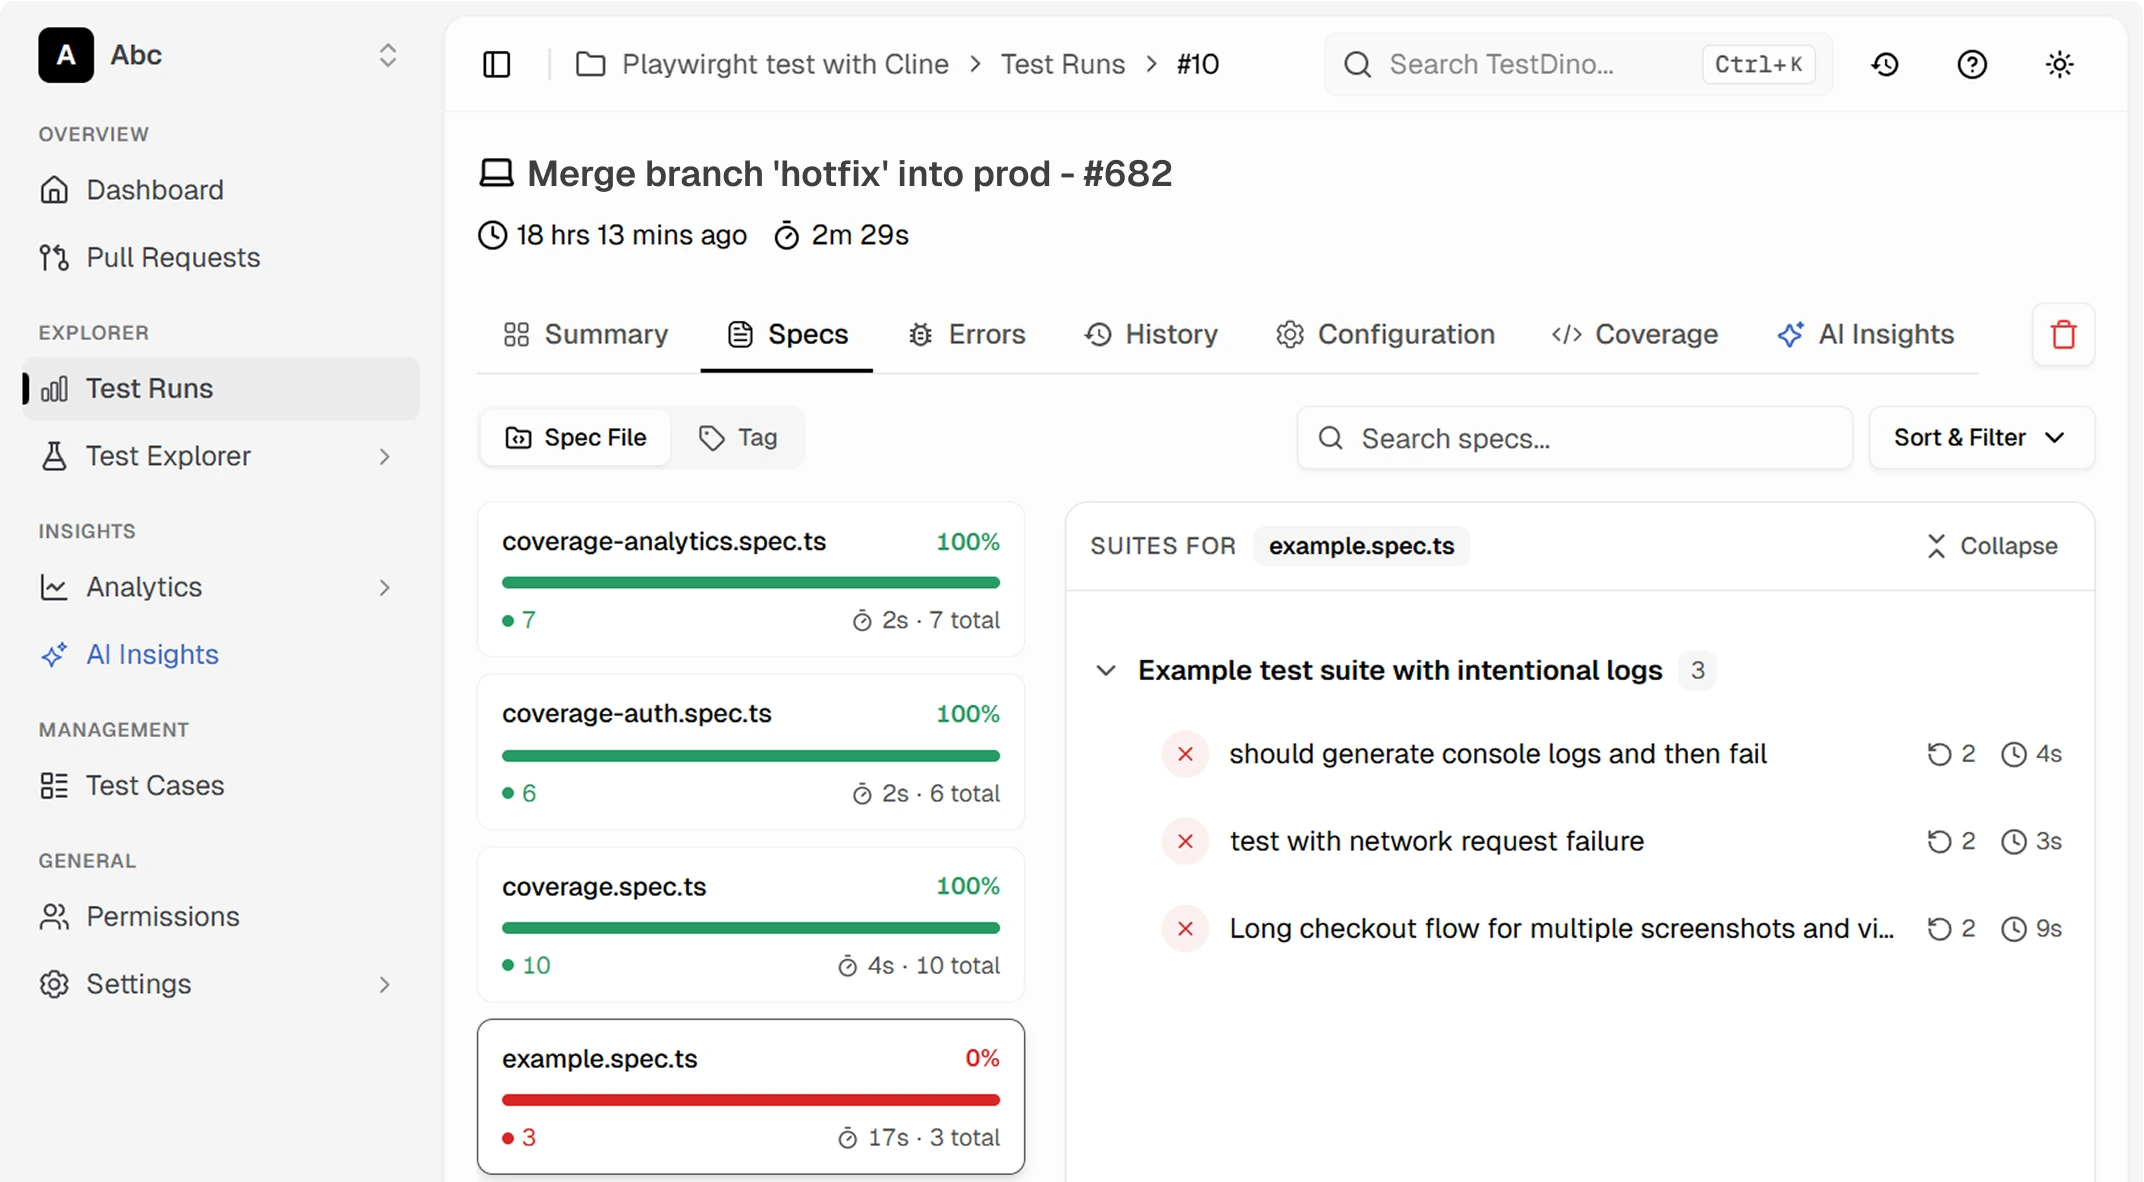
Spec-level and error-level drill-down
Click into any spec file to see its individual tests, or open an error group to view every affected test. Move from a high-level run summary to the failing line of code in two clicks.
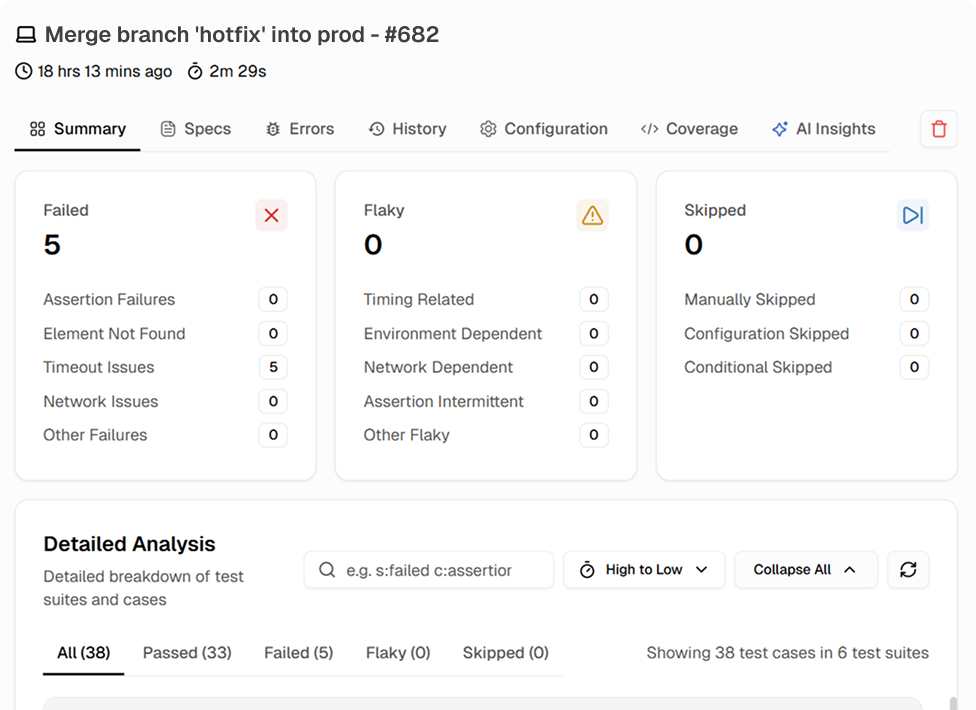
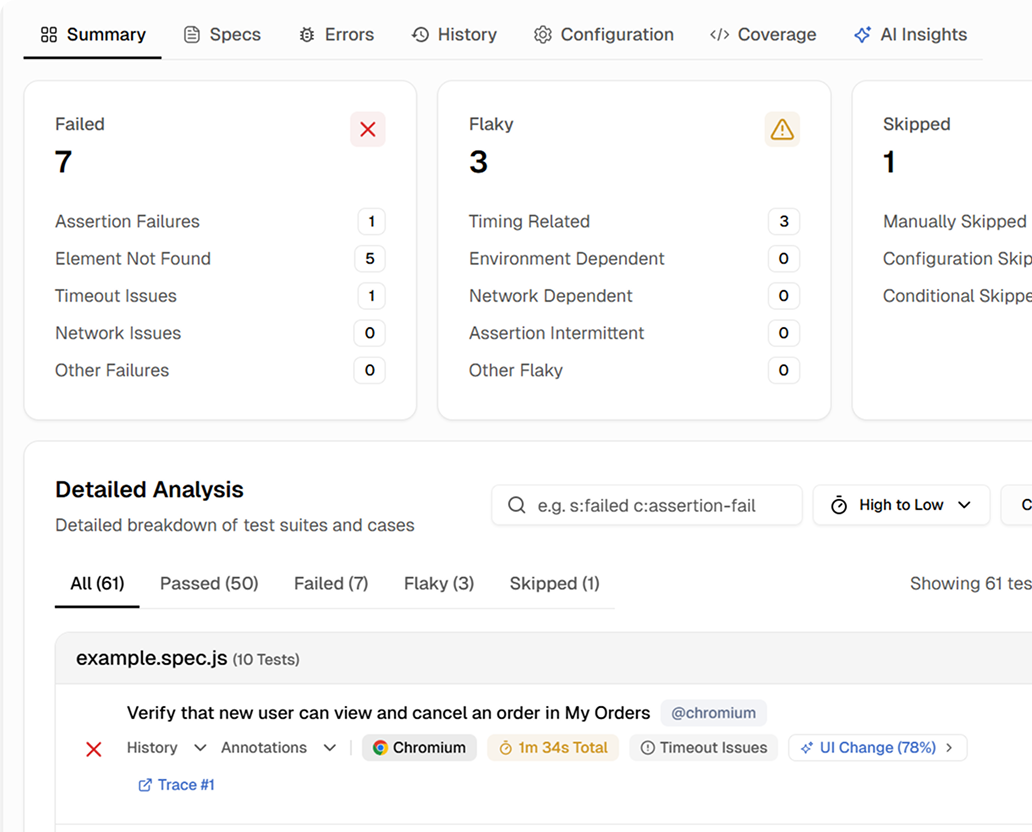
Complete run summary in one view
Total tests, pass rate, failure count, flaky count, duration, and comparison to the previous run. Know the health of your suite in five seconds.
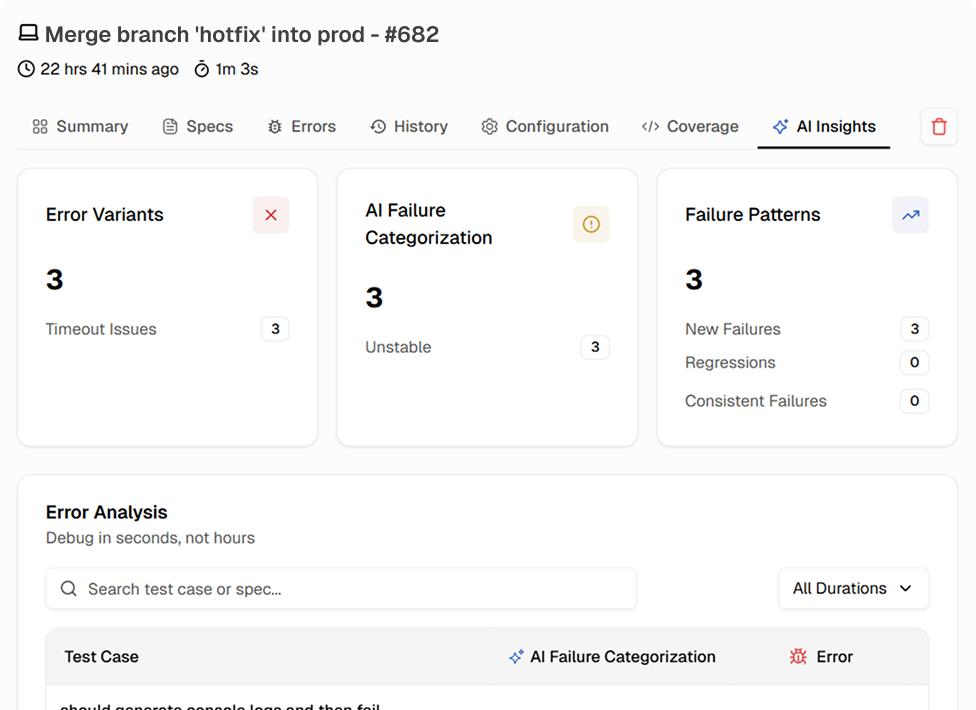
Run insights that highlight what changed and why
The Insights tab analyzes your run against recent history and flags new regressions, recurring patterns, and anomalies. Read a summary that tells you where to look first.
Works with your favourite tools
Connect seamlessly with Jira, Slack, GitHub, Linear, Azure DevOps, Asana, and monday to keep your workflow smooth and your team aligned.
FAQs
A detailed breakdown of a single test execution. TestDino's run reports include a summary tab with pass rate and failure counts, spec file view, error grouping, run-over-run history, configuration metadata, coverage data, and a run insights tab. Every run is stored and accessible.