Catch test regressions before anyone merges.
Test summaries, failure details, and trace links posted directly in your PR with new vs pre-existing classification.

Broken code gets merged because
nobody checks the CI logs
The PR has 3 approvals but nobody expanded the CI logs. Twenty minutes later, main is red.

CI checks say 'failed' but don't say why
GitHub shows a red X next to your CI check. To find out which tests failed, you scroll through 500 lines of terminal output. Most reviewers don't bother.
Reviewers don't have time to investigate test results
Code reviewers are focused on the diff. They're not going to leave the PR, open CI artifacts, and download an HTML report. The friction is high enough that people skip it.
You can't tell which failures are new vs pre-existing
Your branch has 5 test failures. Are they caused by your changes or already failing on main? Without a comparison, you either block unnecessarily or let regressions slip through.
Flaky tests erode trust in the entire CI check
When the same test fails intermittently on every PR, your team starts ignoring all failures. Real regressions hide behind the assumption that it's probably flaky.
The PR looks ready.
Failures stay hidden.
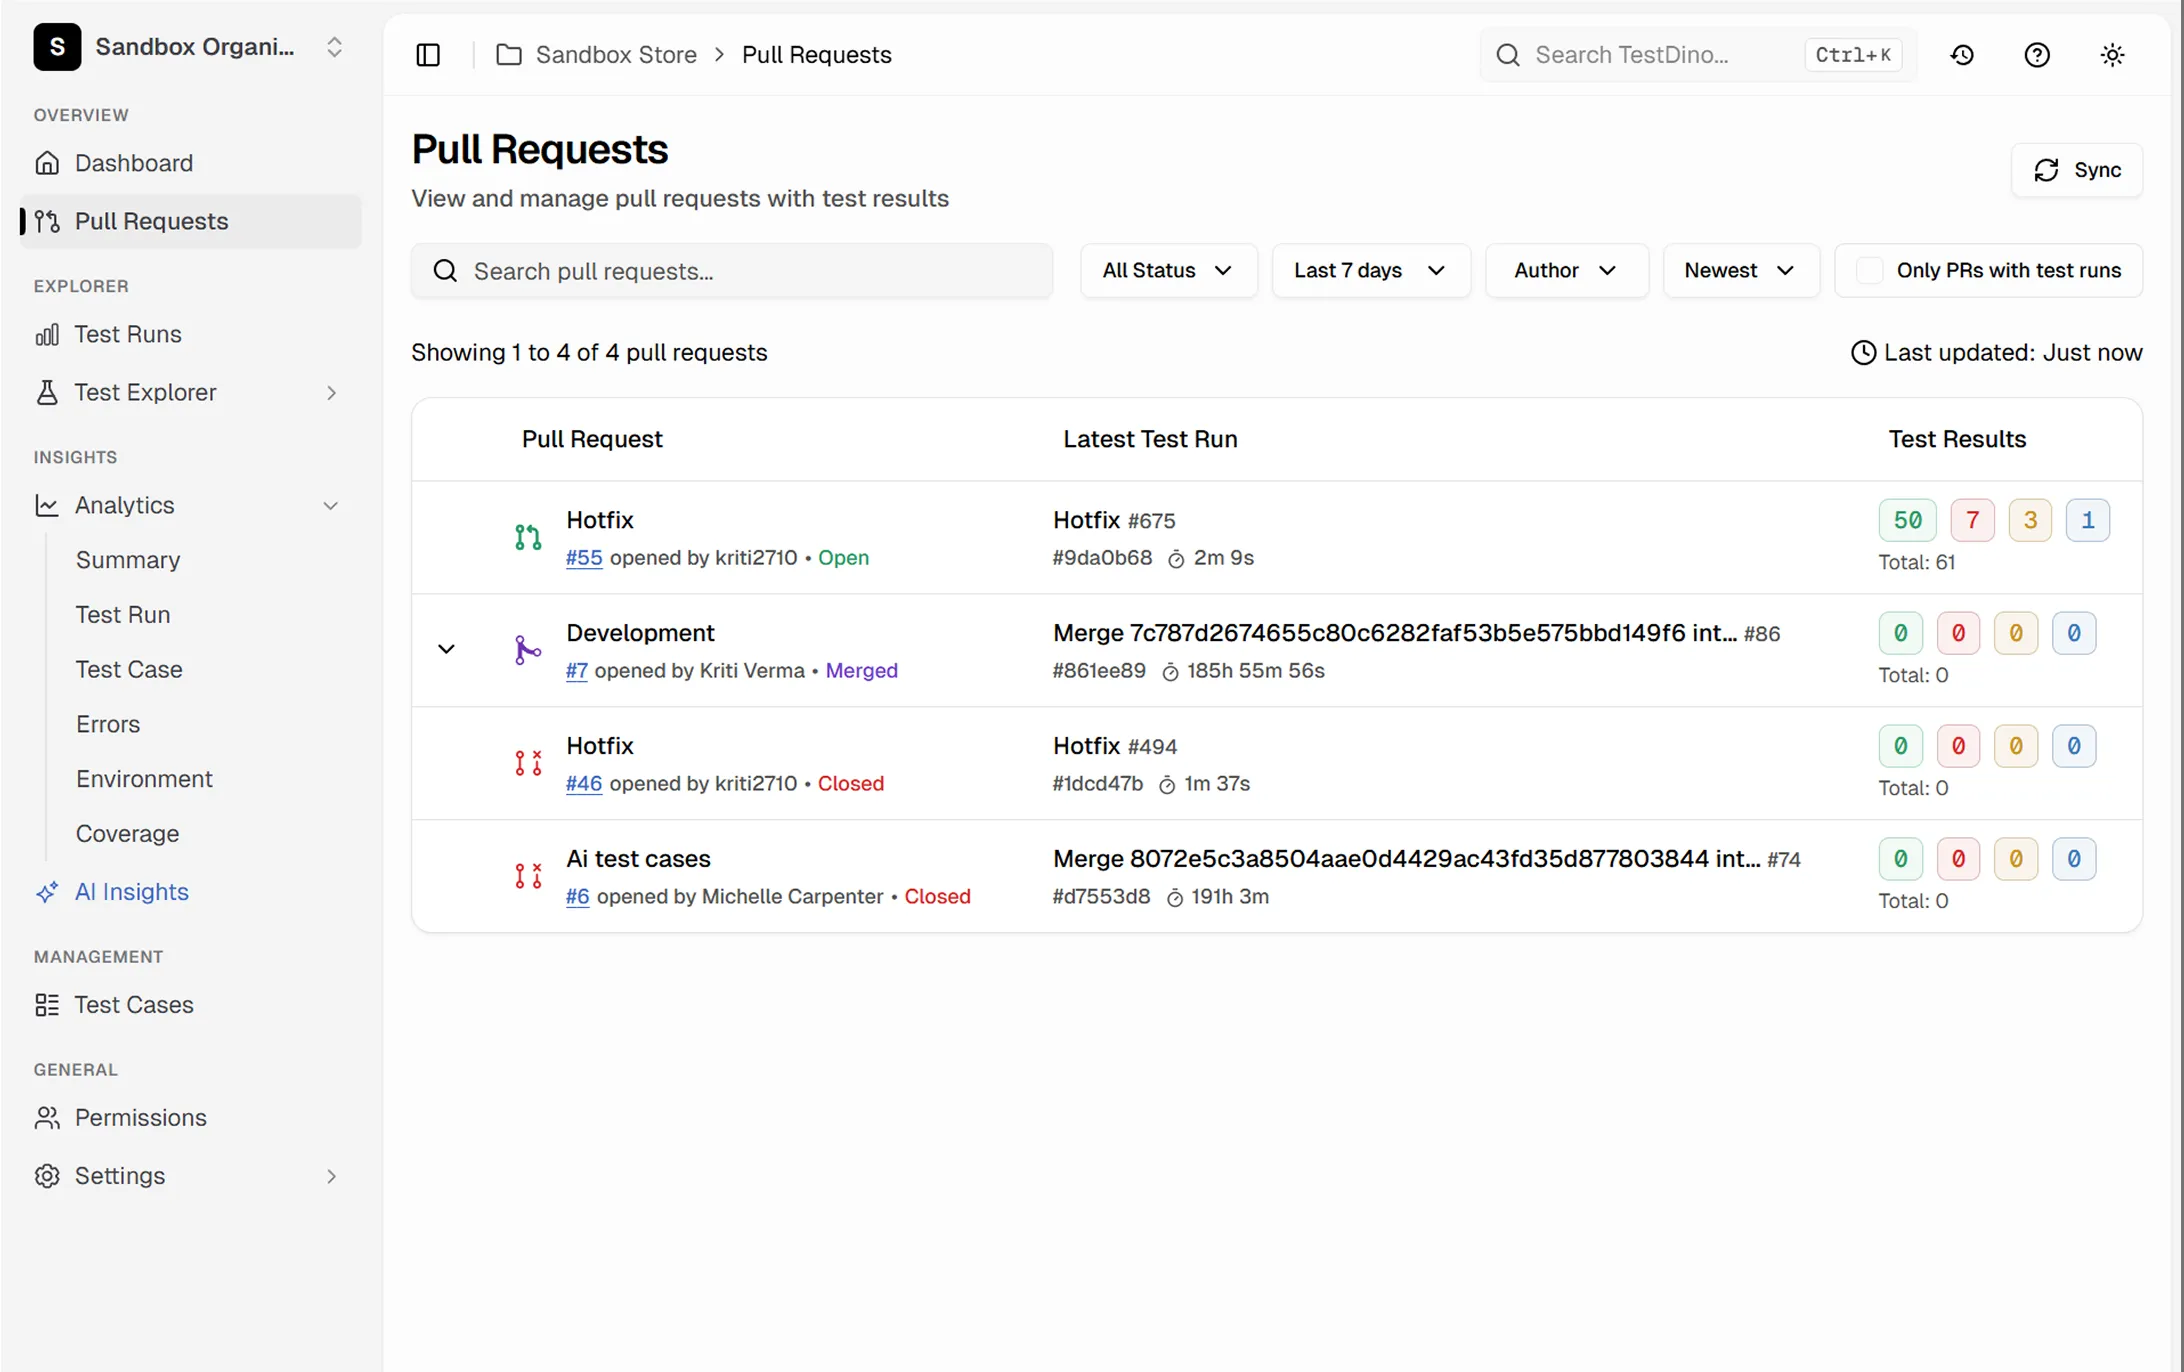
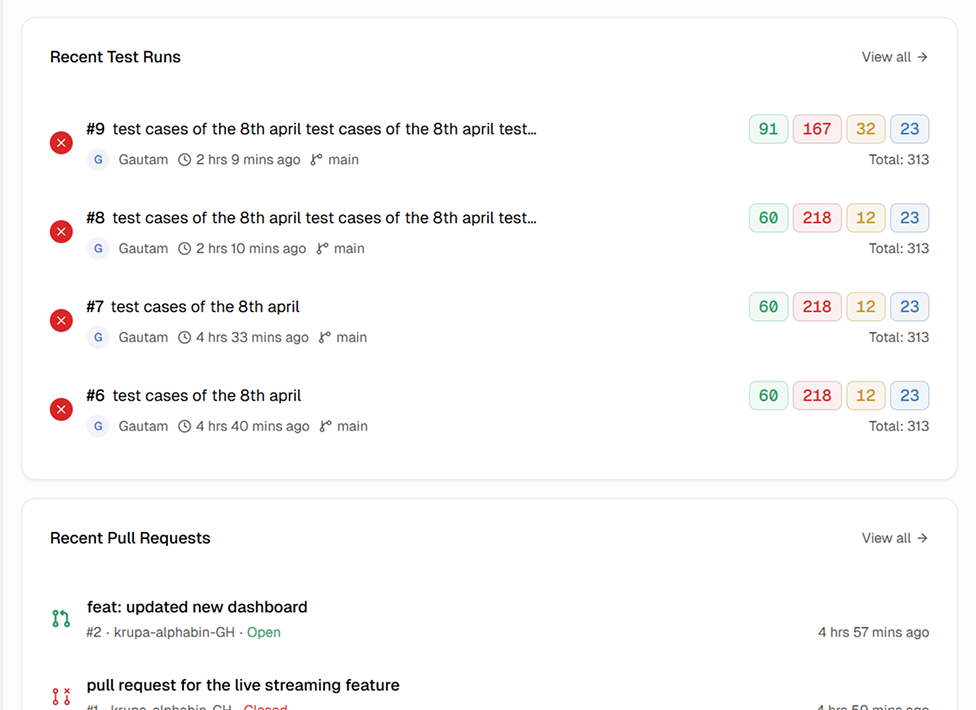
A list of PRs. Nothing about tests.
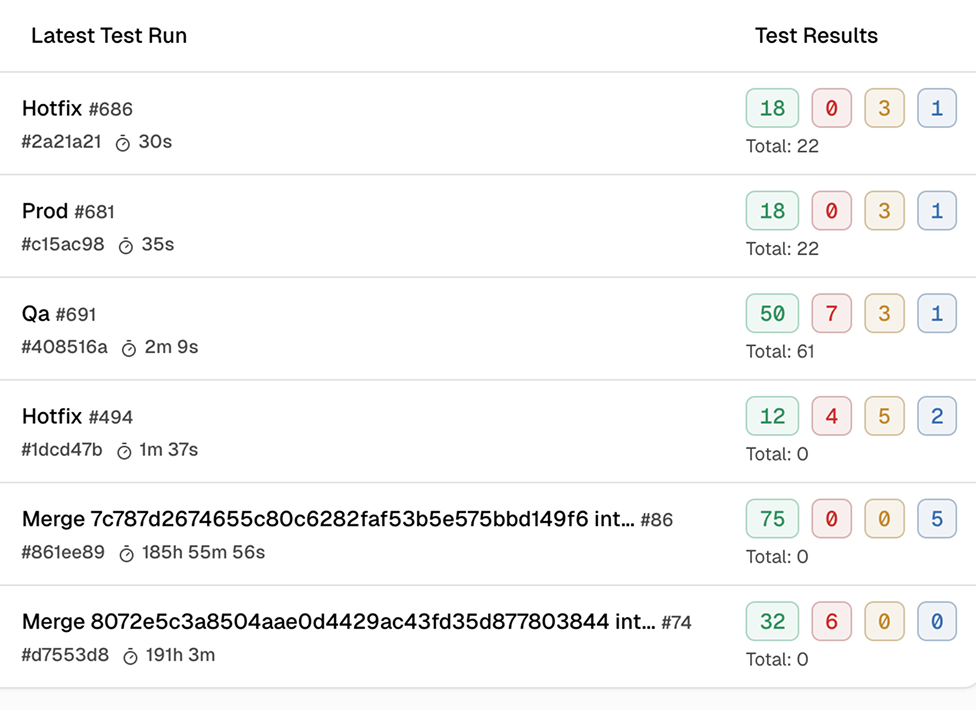
Every PR shows its test health.
How PR test results work
Works out of the box on your first CI run. No GitHub App permissions beyond the basics, no webhooks to set up manually.
Add the TestDino reporter
One line in your Playwright config. TestDino links every test run to its source branch and commit, so results automatically map to the right pull request.

reporter: [
  ['html', { outputDir: './playwright-report' }],
  ['json', { outputFile: './playwright-report/report.json' }],
]
npx tdpw upload <report-dir> --token=$TESTDINO_API_KEY
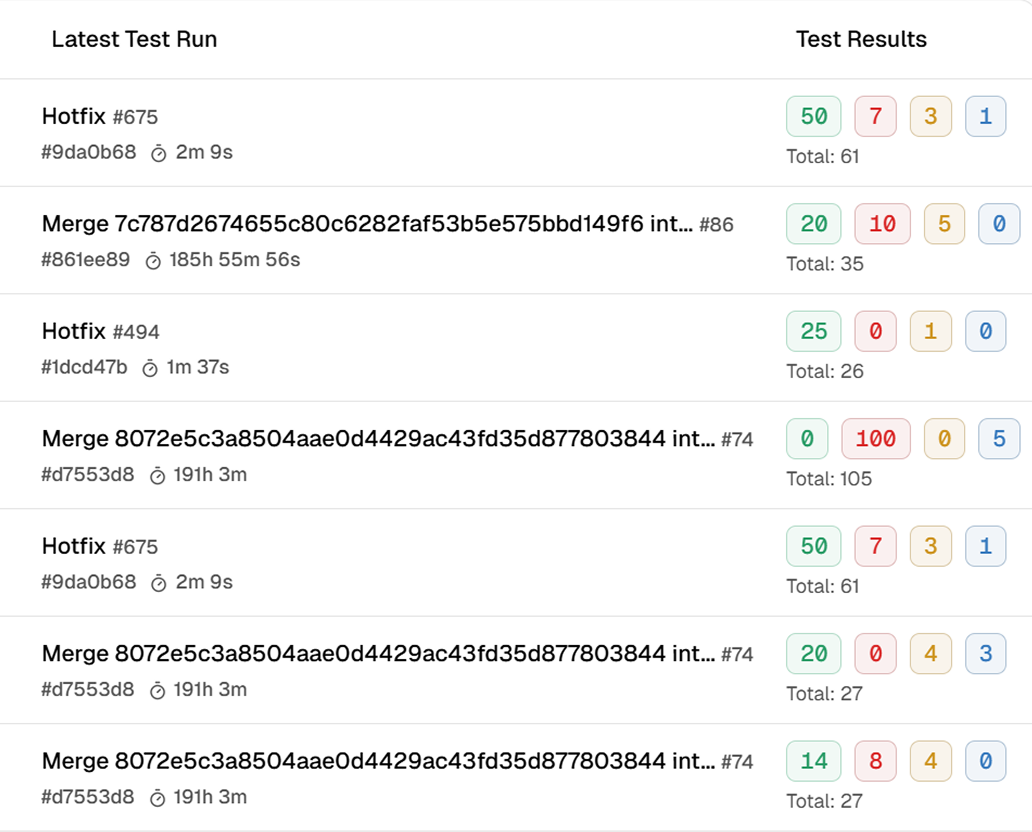
See the test summary inline
TestDino posts a comment or check annotation with a clear summary: total tests, pass rate, new failures, flaky tests, and duration. The signal is immediate - no clicking into CI logs.

Click any failure for context
Each failure in the PR summary links directly to the TestDino dashboard - trace viewer, stack trace, screenshots, and error grouping. One click from 'test failed' to 'here's what broke.'
Let your AI agent review test results
Connect TestDino's MCP server to Cursor, Claude Code, or Copilot. Your AI agent pulls branch and commit test results behind your PR, sees what failed, and suggests fixes without you leaving your code.

Teams love what we built
See why developers choose TestDino to ship faster and debug smarter
Over 30 flaky tests and no structured way to track them, just CI artifacts and morning guesswork. TestDino's "Most Flaky Tests" feature broke this pattern. We can see failure trends now and pull up video recordings of exactly what went wrong. The TestDino MCP server is the magic piece on top, I ask my Claude agent about a failure and it pulls full context from TestDino without switching tabs. We went from 30-something flaky tests down to 3 or 4.
Fewer flaky test reruns
Faster failure triage

Migrating to TestDino from Currents was an easy decision. The features are stronger, the cost is lower, and the interface makes debugging far less painful. Flaky test detection and AI failure classification have simplified debugging and reduced our CI costs by cutting down reruns and noisy failures.
Reduction in CI costs
Less time triaging failures

Everything you need for
confident merge decisions
Inline test summary on every pull request
Every PR gets a summary with pass count, fail count, flaky count, and duration compared to the base branch.
New vs pre-existing failure classification
Your branch is compared to the base branch, flagging which failures are new regressions vs pre-existing. No guessing required.
Direct links to traces and error details
Each failure in the PR summary links to the trace viewer, stack trace, and screenshots. One click to the exact failure moment.
Flaky test indicators per PR
Tests that passed on retry are flagged as flaky in the PR summary, separating real regressions from intermittent noise.
Files changed view with run context
The Files Changed tab in your PR workspace shows which commits and runs are associated with each change, so you can trace failures back to specific changes.
Execution timeline with shard details
Timeline shows when each test ran, which shard handled it, and how long it took. Slow tests and shard imbalances are visible.
What you get with PR test results
Test visibility where merge decisions happen.
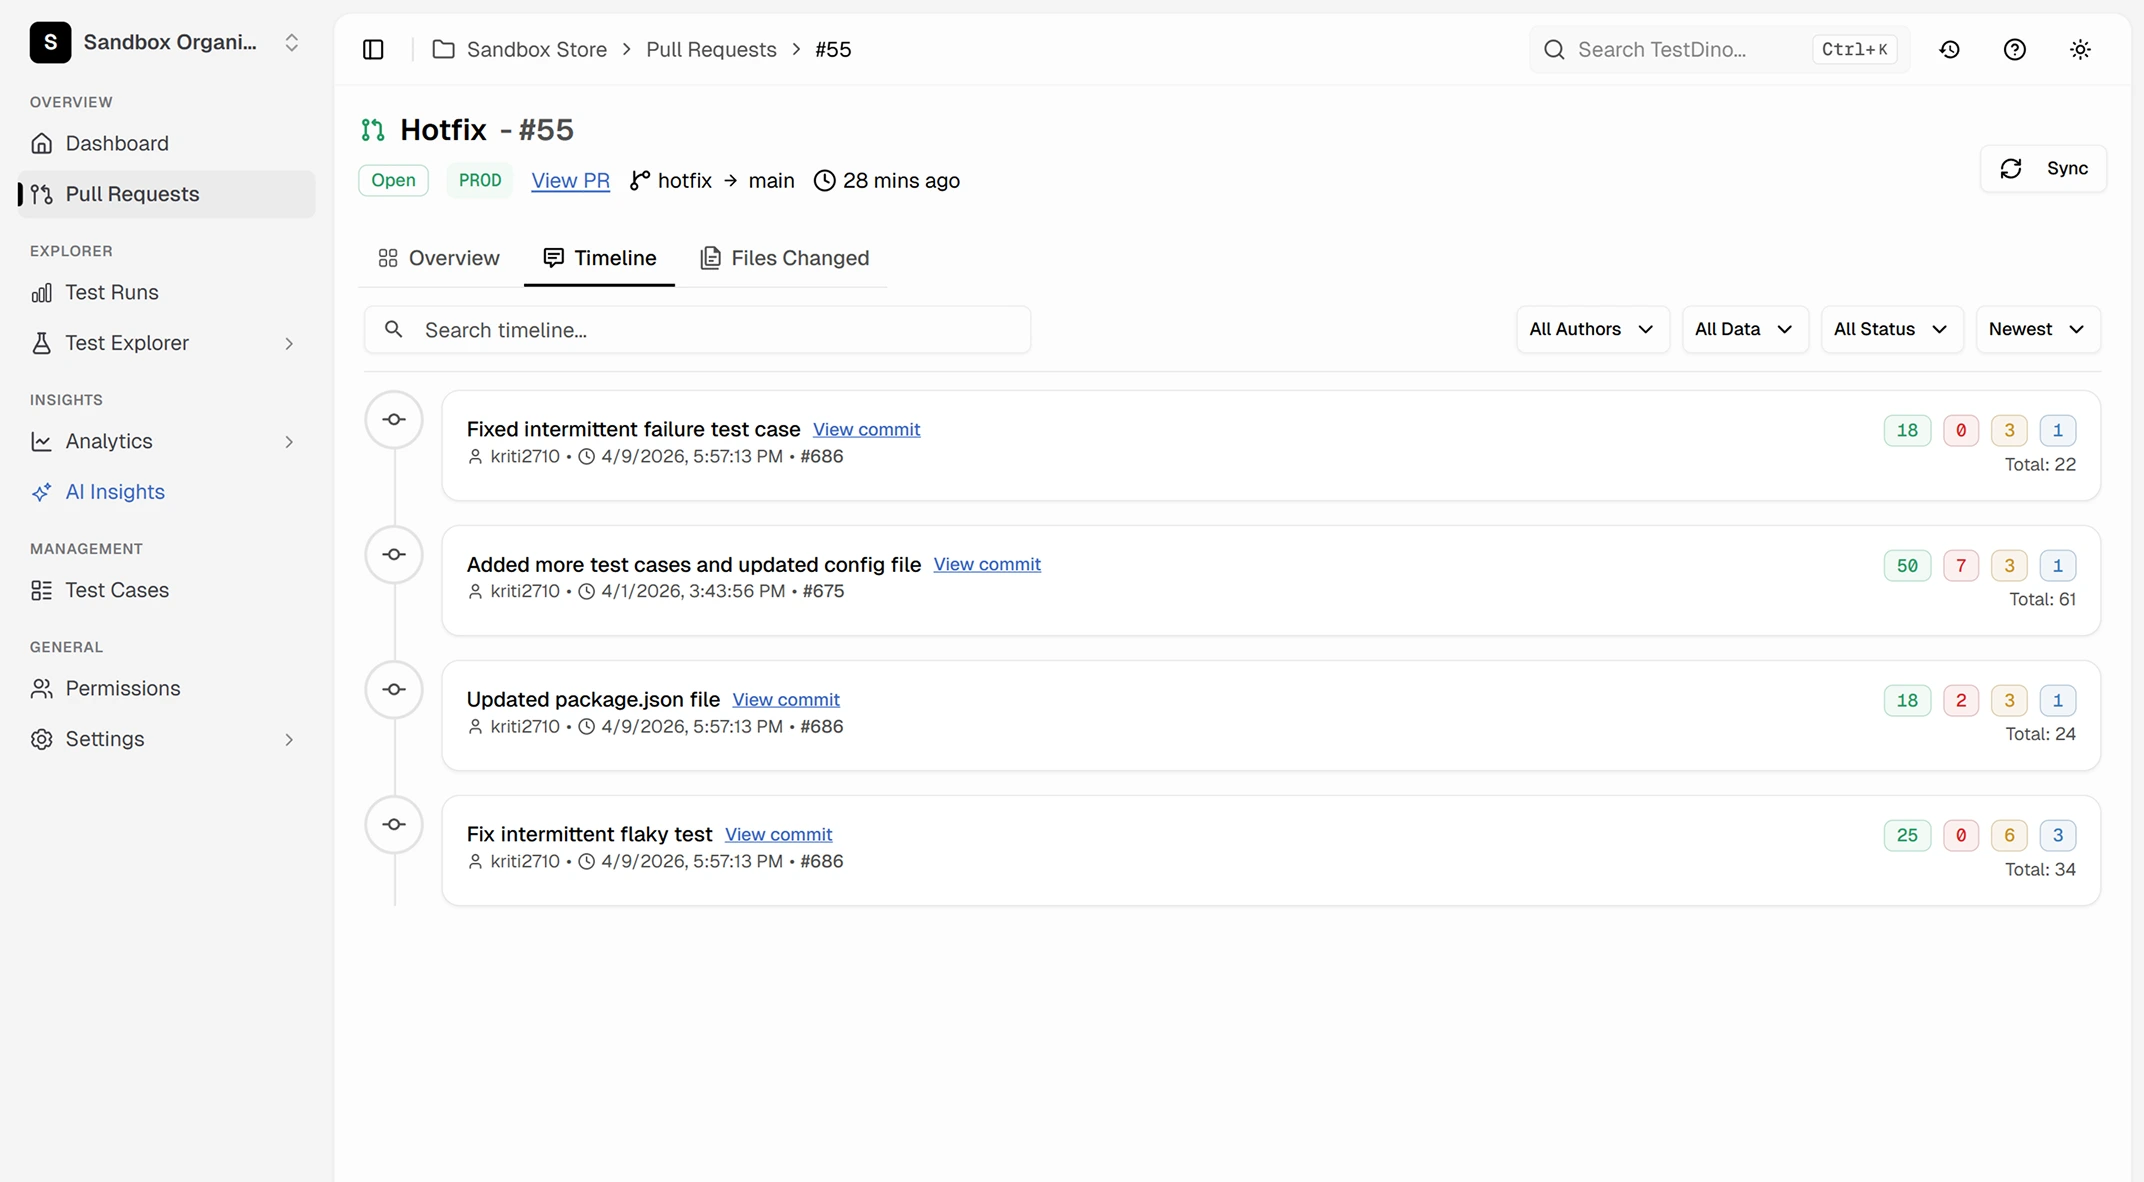
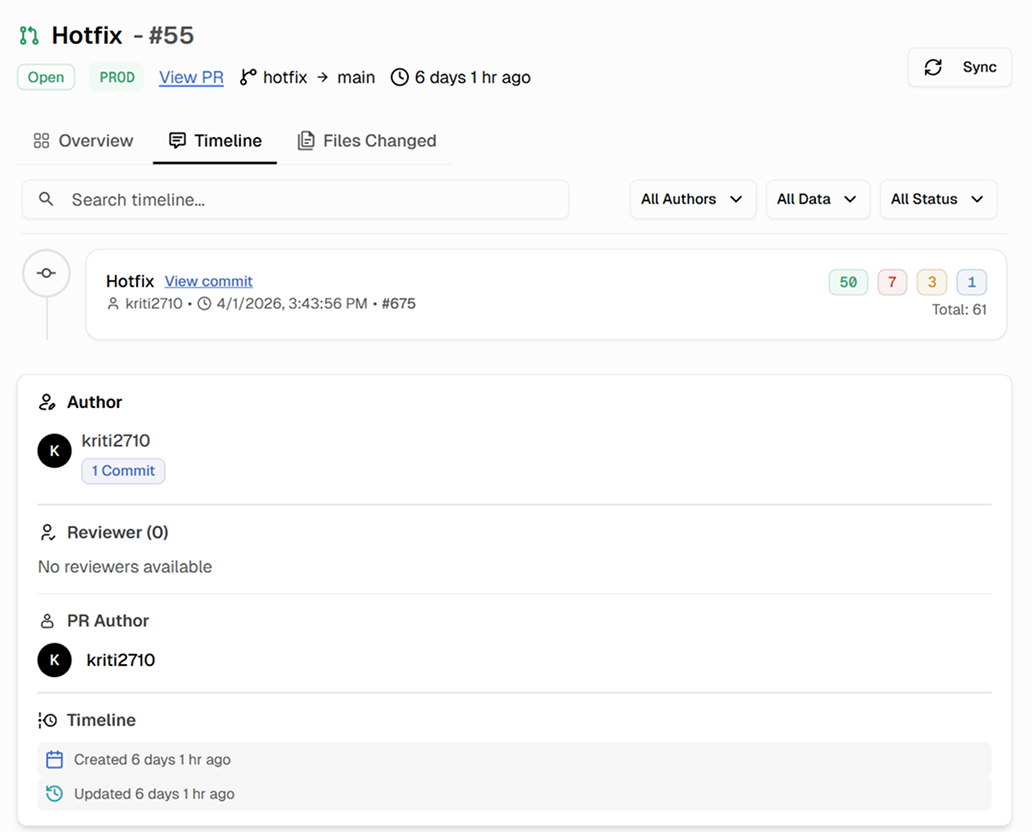
Test history tied to every PR
Every pull request has a dedicated view with a Timeline tab showing all commits and their test runs, a Files Changed tab with code diff context, and KPI tiles tracking pass rate, duration, and run count across the full PR history.
Immediate pass/fail signal without opening CI logs
The test summary is posted directly in your pull request. Reviewers see pass rate, failure count, and flaky count at a glance. Merge decisions informed by data, not hope.
New regression detection that separates signal from noise
TestDino classifies each failure as new or pre-existing. Your team blocks merges on real regressions and stops blocking on failures that were already there.
Works with your favourite tools
Connect seamlessly with Jira, Slack, GitHub, Linear, Azure DevOps, Asana, and monday to keep your workflow smooth and your team aligned.
FAQs
TestDino connects to your GitHub repository and automatically posts a test summary as a PR comment or check run annotation after each CI run. The summary includes total tests, pass rate, failures, flaky tests, and duration. No manual steps or webhook configuration required.