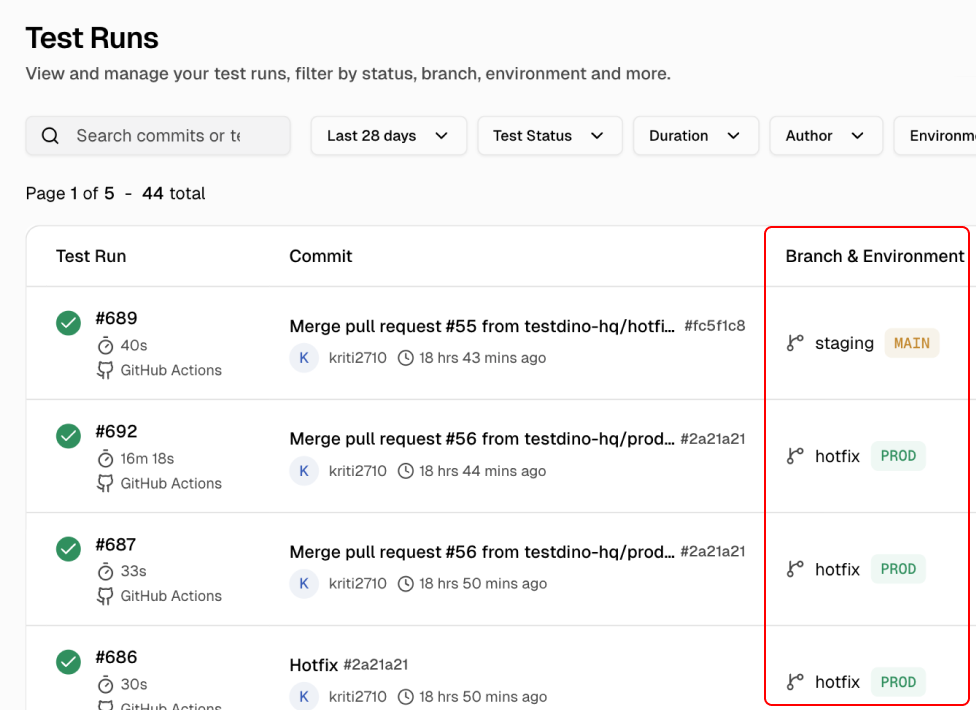
Test health per environment, not a blurred average.
TestDino maps Git branches to named environments so you filter trends, compare failures, and debug in the right context.

Mixed environments corrupt
your test data
Without environment context, your failure data is just noise you cannot act on.

Staging failures pollute production trend lines
A staging deploy that breaks 30 tests skews your entire failure trend. Your weekly report looks terrible, but production is fine. You spend meetings explaining numbers that do not reflect reality.
Branch environments have no identity
Your team spins up preview environments per branch, but results just say the branch name with no mapping to a logical environment. You cannot filter or trend by environment because there is no environment concept in your data.
Comparing test health across environments is manual
Someone asks "Is staging more stable than dev?" and you open three tabs, eyeball failure counts, and normalize for different test volumes. There is no side-by-side comparison.
Environment-specific flaky tests go undetected
A test flaky only in dev gets flagged as flaky globally. Your team wastes time investigating in staging where it runs perfectly. Without environment scoping, flaky detection cannot tell you where instability lives.
Branch names change. Your environments should not.
Test runs scattered across branches
Branch & environment analytics
How environment mapping works
Works out of the box with your existing branch and CI setup. No config changes to test files, no environment variables to manage, no tagging conventions to enforce.
Add the TestDino reporter
One line in your Playwright config. The reporter automatically captures the Git branch, commit SHA, and CI metadata for every run.

reporter: [
  ['html', { outputDir: './playwright-report' }],
  ['json', { outputFile: './playwright-report/report.json' }],
]
npx tdpw upload <report-dir> --token=$TESTDINO_API_KEY
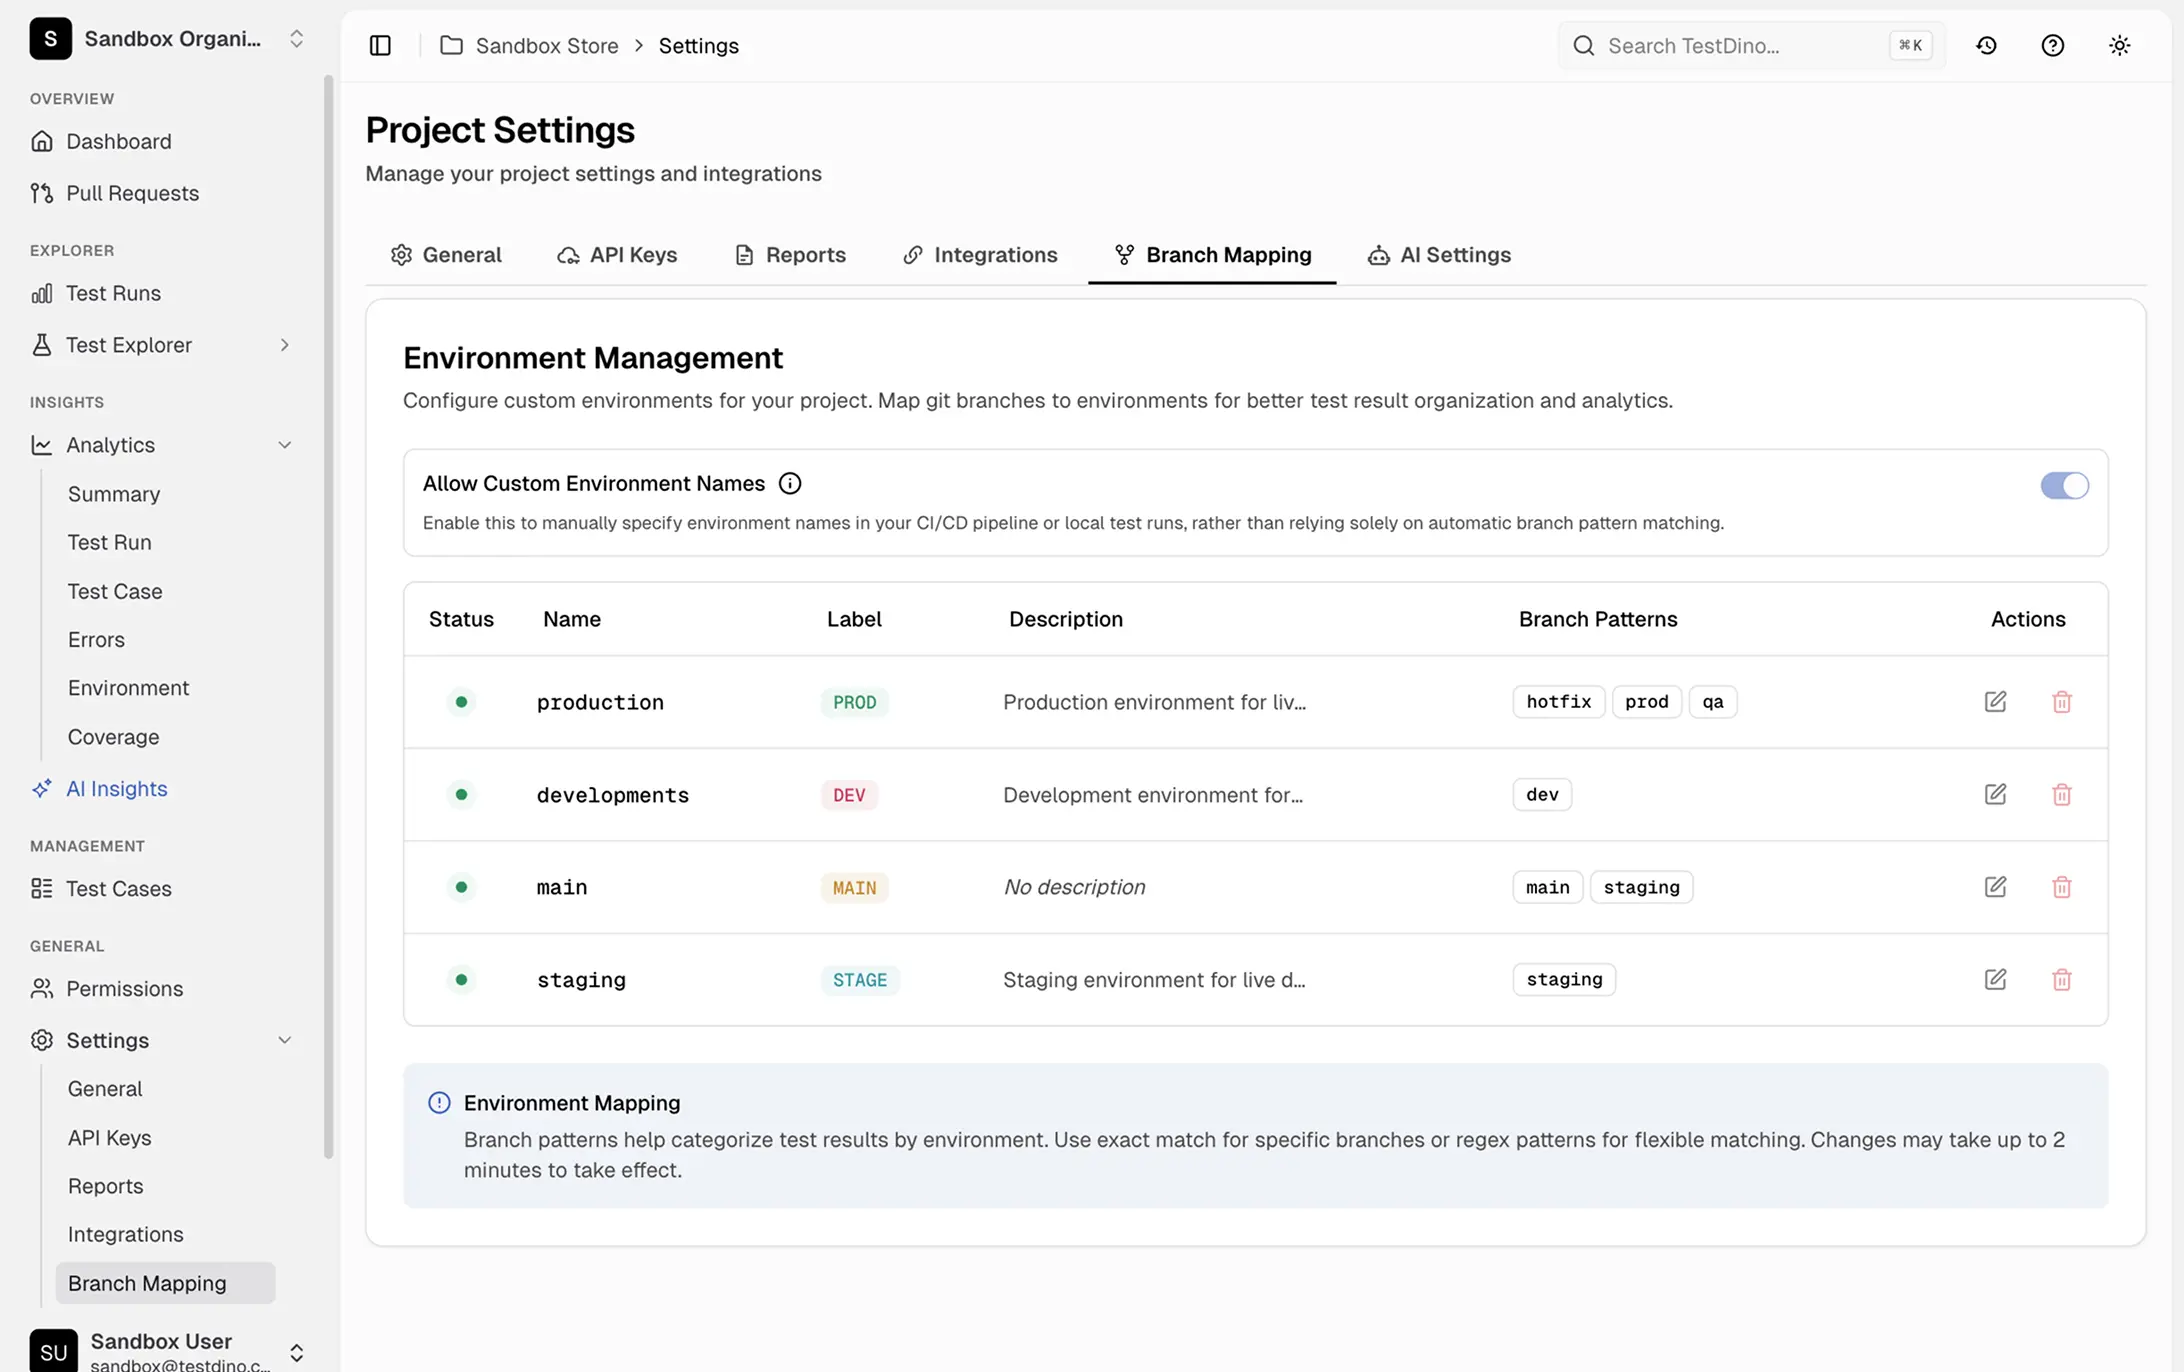
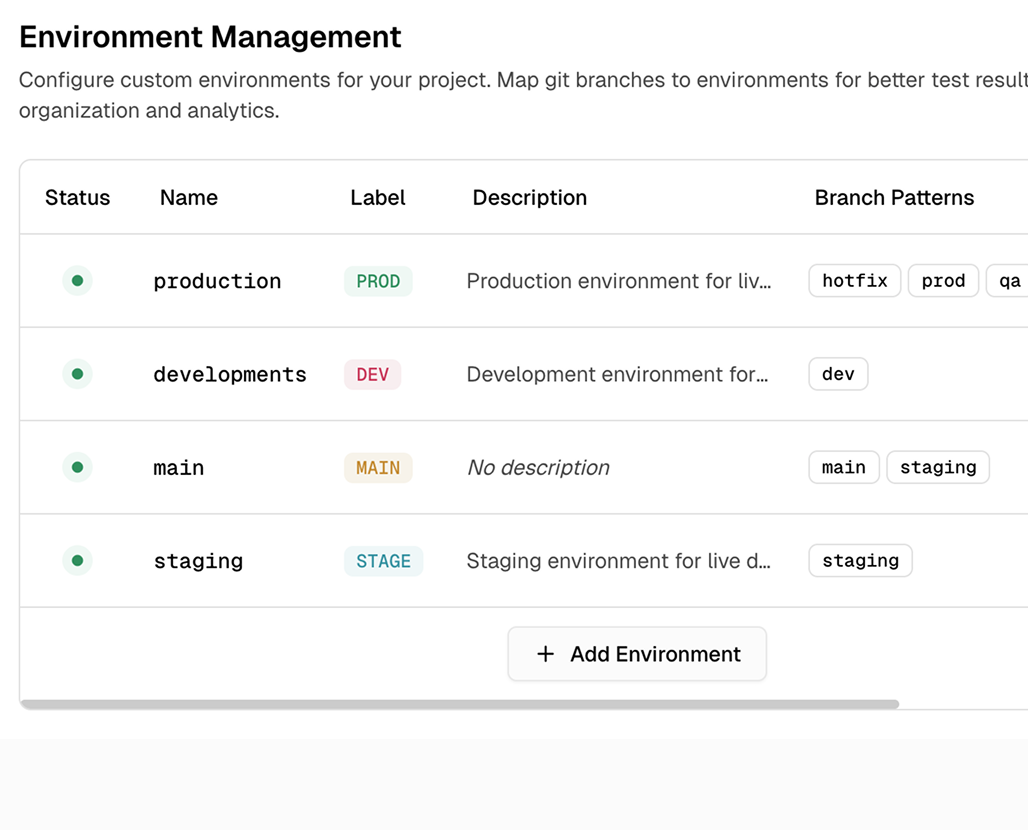
Define environment mappings
In the TestDino dashboard, map branch patterns to named environments using regex. main maps to Production, ^staging/ maps to Staging, ^feature/ maps to Preview. Patterns are case-insensitive and support anchors.

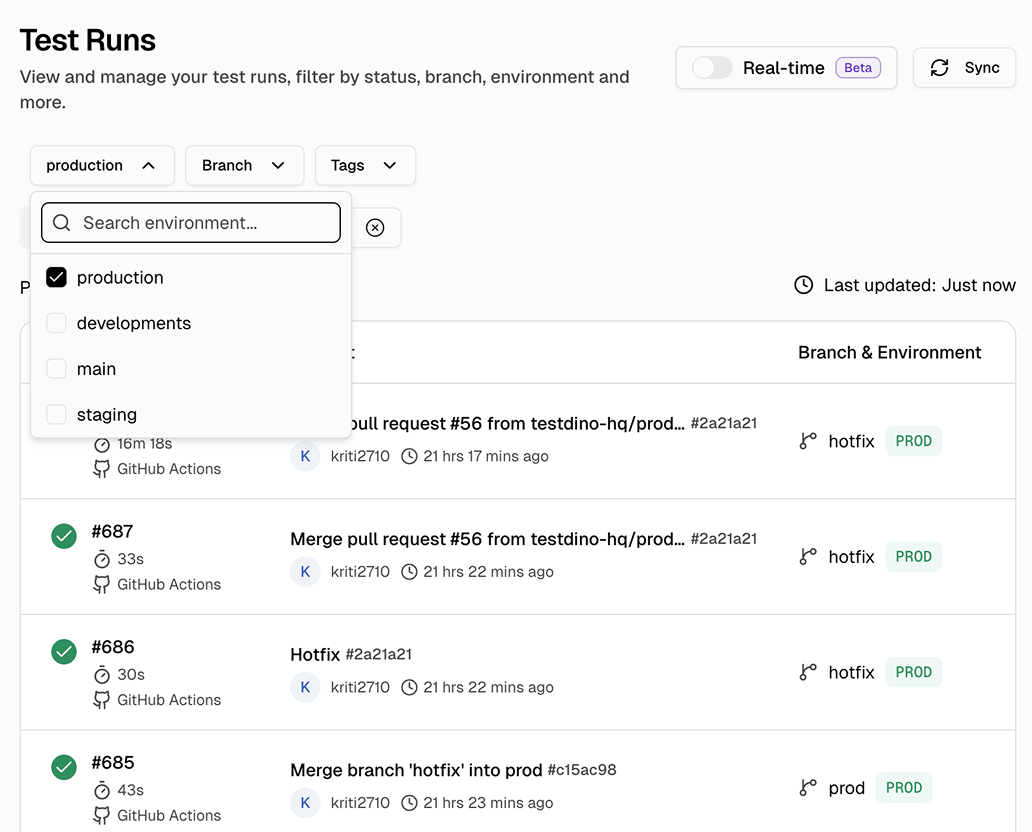
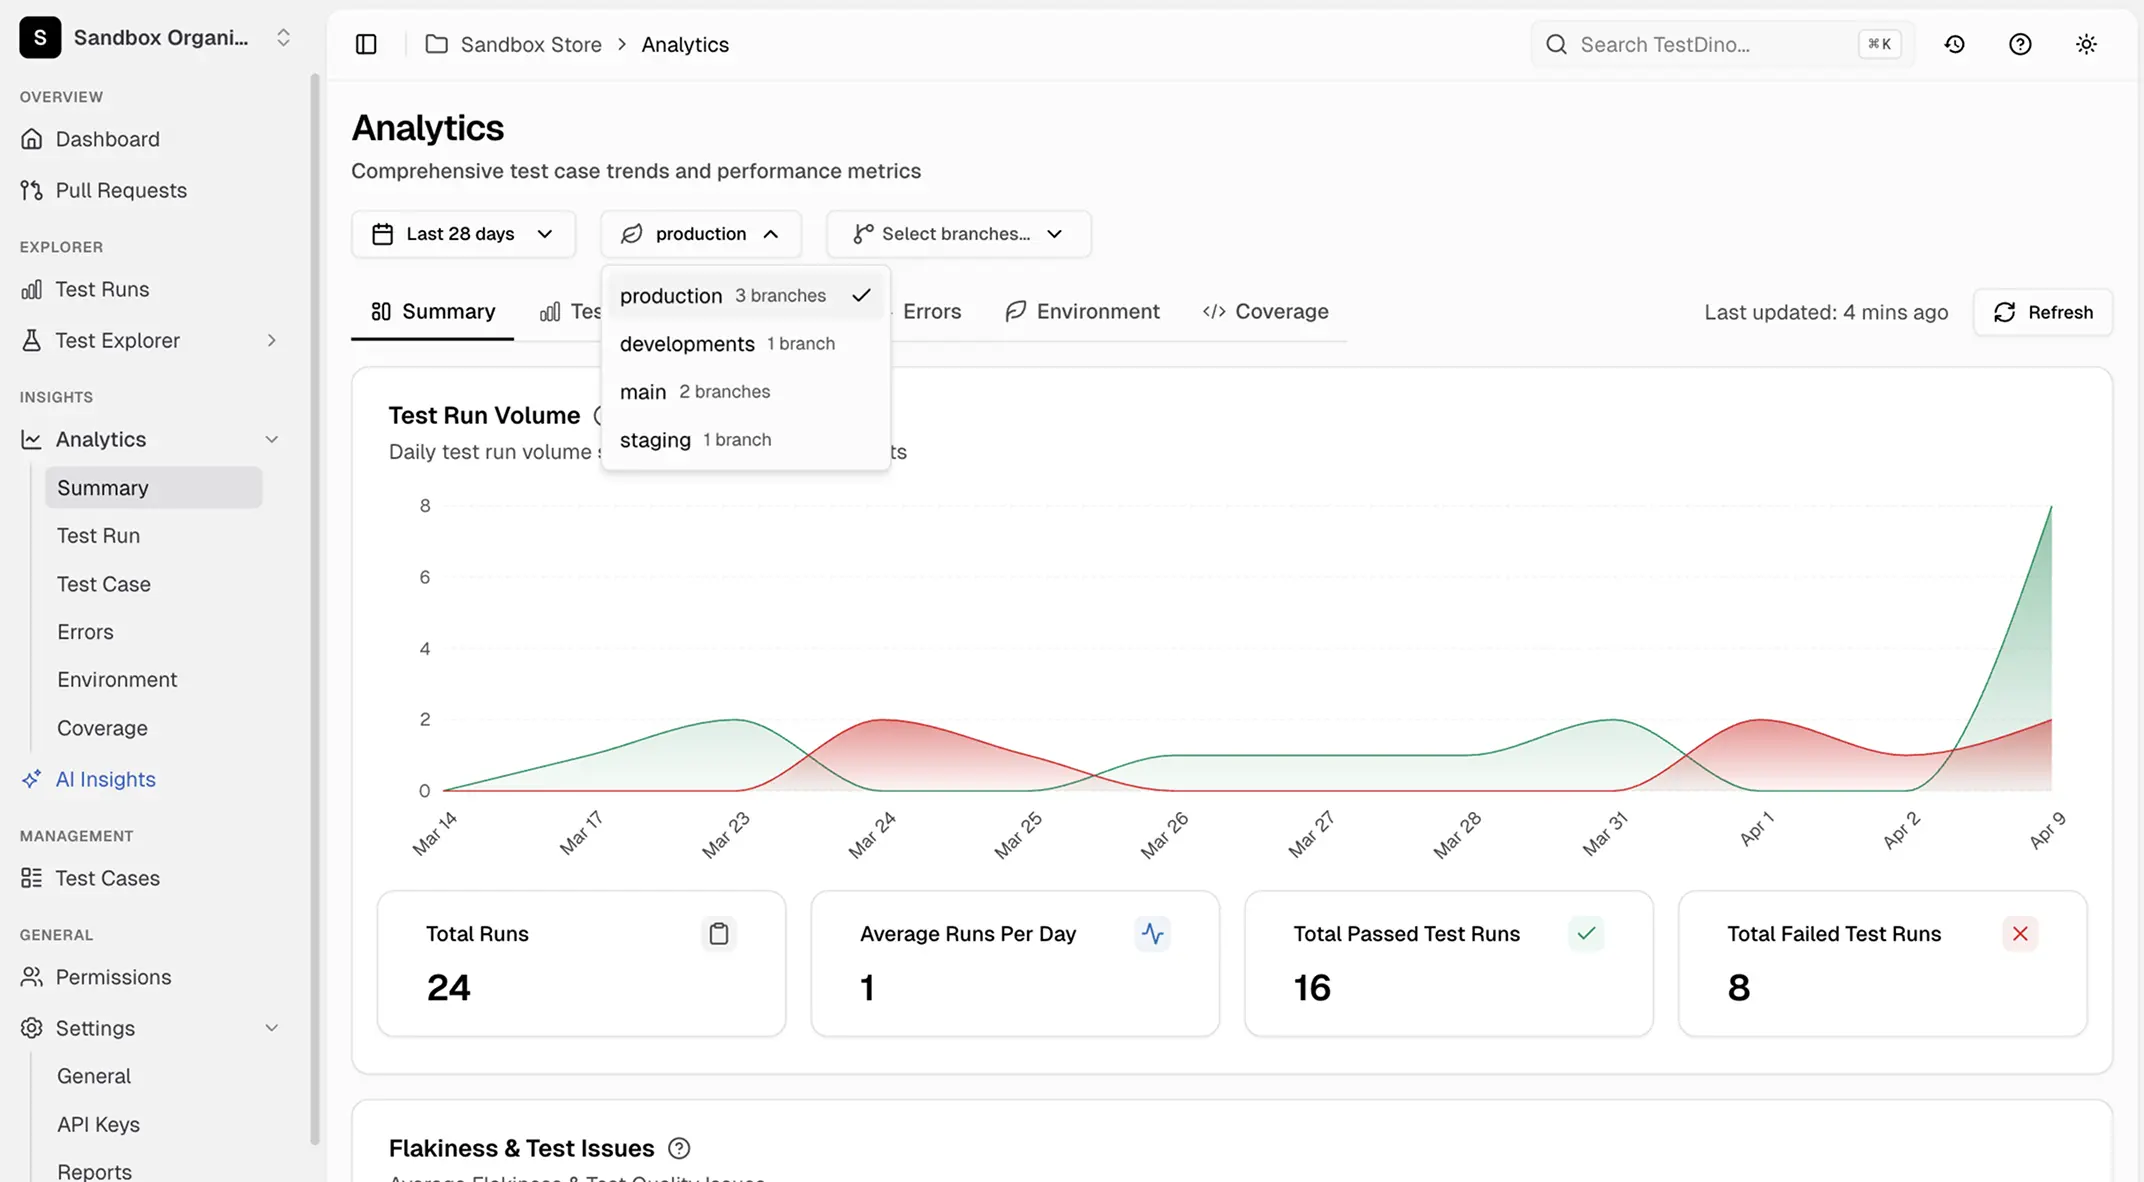
Filter and compare by environment
Every dashboard, trend chart, and failure analysis view now supports environment filtering. See flaky tests in Staging only. Compare pass rates between Production and Development.
Teams love what we built
See why developers choose TestDino to ship faster and debug smarter
Over 30 flaky tests and no structured way to track them, just CI artifacts and morning guesswork. TestDino's "Most Flaky Tests" feature broke this pattern. We can see failure trends now and pull up video recordings of exactly what went wrong. The TestDino MCP server is the magic piece on top, I ask my Claude agent about a failure and it pulls full context from TestDino without switching tabs. We went from 30-something flaky tests down to 3 or 4.
Fewer flaky test reruns
Faster failure triage

Migrating to TestDino from Currents was an easy decision. The features are stronger, the cost is lower, and the interface makes debugging far less painful. Flaky test detection and AI failure classification have simplified debugging and reduced our CI costs by cutting down reruns and noisy failures.
Reduction in CI costs
Less time triaging failures

Environment-aware analytics
across your pipeline
Named environments from branch patterns
Branch names like feature/AUTH-234 map to logical environments like Preview or Development, so dashboards reflect your real infrastructure.
Scoped flaky detection
A test flagged flaky globally might only be flaky in one environment. Flaky detection runs per environment so you know exactly where.
Side-by-side environment comparison
Compare pass rates, failure counts, and flaky trends per environment in one view without switching tabs.
Regex-based branch mapping
Regex patterns handle branch mappings with support for anchors, case-insensitive matching, and alternation. New branch conventions don't require config changes as your strategy evolves.
Environment-scoped alerts
Production failures go to the high-priority Slack channel, staging noise to the QA channel. Right people, right environment.
Historical trends per environment
Aggregated pass rates hide environment differences. Trends break down by environment so you see the real health of each target.
What you get with environment mapping
Same test data, completely different story. See where problems live and where to focus your effort.
Environment-scoped dashboards and analytics
Every view in TestDino supports environment filtering, including failure trends, flaky detection, pass rate charts, and duration tracking. Slice your data by Production, Staging, Development, or any custom environment name your team uses.
Automatic branch-to-environment mapping
Define regex patterns once and every future test run is automatically categorized into the right environment. No manual tagging, no CI variable management, no per-test annotations.
Per-environment analytics and health tracking
View success rates, branch distribution, OS coverage, and pass rate trends scoped to each environment. Spot instability in staging before it reaches production.
Works with your favourite tools
Connect seamlessly with Jira, Slack, GitHub, Linear, Azure DevOps, Asana, and monday to keep your workflow smooth and your team aligned.
FAQs
Environment mapping associates Git branches with named deployment environments like Production, Staging, or Development so test results can be filtered, compared, and trended per environment. TestDino uses regex patterns to automatically categorize every test run.